Xcel Energy 2010 Annual Report Download - page 72
Download and view the complete annual report
Please find page 72 of the 2010 Xcel Energy annual report below. You can navigate through the pages in the report by either clicking on the pages listed below, or by using the keyword search tool below to find specific information within the annual report.-
 1
1 -
2
-
3
-
4
-
5
-
6
-
7
-
8
-
9
-
10
-
11
-
12
-
13
-
14
-
15
-
16
-
17
-
18
-
19
-
20
-
21
-
22
-
23
-
24
-
25
-
26
-
27
-
28
-
29
-
30
-
31
-
32
-
33
-
34
-
35
-
36
-
37
-
38
-
39
-
40
-
41
-
42
-
43
-
44
-
45
-
46
-
47
-
48
-
49
-
50
-
51
-
52
-
53
-
54
-
55
-
56
-
57
-
58
-
59
-
60
-
61
-
 62
62 -
 63
63 -
 64
64 -
 65
65 -
 66
66 -
 67
67 -
 68
68 -
 69
69 -
 70
70 -
 71
71 -
 72
72 -
 73
73 -
 74
74 -
 75
75 -
 76
76 -
 77
77 -
 78
78 -
 79
79 -
 80
80 -
 81
81 -
 82
82 -
83
-
84
-
85
-
86
-
87
-
88
-
89
-
90
-
91
-
92
-
93
-
94
-
95
-
96
-
97
-
98
-
99
-
100
-
101
-
102
-
103
-
104
-
105
-
106
-
107
-
108
-
109
-
110
-
111
-
112
-
113
-
114
-
115
-
116
-
117
-
118
-
119
-
120
-
121
-
122
-
123
-
124
-
125
-
126
-
127
-
128
-
129
-
130
-
131
-
132
-
133
-
134
-
135
-
136
-
137
-
138
-
139
-
140
-
141
-
142
-
143
-
144
-
145
-
146
-
147
-
148
-
149
-
150
-
151
-
152
-
153
-
154
-
155
-
156
-
157
-
158
-
159
-
160
-
161
-
162
-
163
-
164
-
165
-
166
-
167
-
168
-
169
-
170
-
171
-
172
 |
 |

62
Non-Fuel Operating Expenses and Other Items
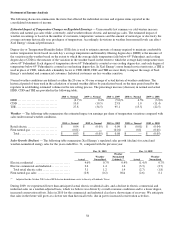
O&M Expenses — O&M expenses increased by approximately $149.2 million, or 7.8 percent, for 2010 compared with 2009, and
by $130.2 million, or 7.3 percent, for 2009 compared with 2008.
(Millions of Dollars) 2010 vs.
2009
Higher plant generation costs ............................................................................ $47
Higher labor costs ....................................................................................... 24
Higher nuclear plant operation costs ...................................................................... 20
Higher contract labor costs ............................................................................... 18
Higher employee benefit expense ......................................................................... 15
Higher nuclear outage costs, net of deferral ................................................................ 10
Other, net .............................................................................................. 15
Total increase in operating and maintenance expenses .................................................... $ 149
2010 Comparison to 2009 — The increase in O&M expenses for 2010 was largely driven by the following:
● Higher plant generation costs are primarily attributable to the timing of planned maintenance and overhaul work as well
as incremental operating costs associated with new generation facilities placed in service in 2010.
● Higher contract labor is primarily related to maintenance on our distribution facilities.
● Higher nuclear plant operation costs are mainly due to increased labor and security expenses.
● Higher labor costs are primarily due to higher overtime for storm restoration work and a shift in labor resources from
capital to O&M projects.
● Higher nuclear outage costs are due to the timing and higher cost of nuclear refueling outages.
● Higher employee benefit costs for the year are primarily due to increased pension costs partially offset by lower health
care costs.
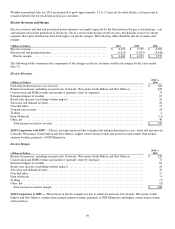
(Millions of Dollars) 2009 vs.
2008
Higher employee benefit expense ......................................................................... $90
N
uclear outage costs, net of deferral ...................................................................... 30
Higher nuclear plant operation costs ...................................................................... 21
Higher plant generation costs ............................................................................ 9
Higher labor costs ....................................................................................... 6
Lower consulting costs .................................................................................. (18)
Other, net .............................................................................................. (8)
Total increase in operating and maintenance expenses .................................................... $ 130
2009 Comparison to 2008 — The increase in O&M expenses for 2009 was largely driven by the following:
● Higher employee benefits costs are primarily attributable to 2009 employee performance based incentive compensation
expenses, higher pension expenses and increased medical expenses. In 2008, no employee performance based incentive
benefits were earned.
● The increase in nuclear outage costs is due to the commissions’ approval of the change in the nuclear refueling outage
recovery method from the direct expense method to the deferral and amortization method in 2008.
● The increase in nuclear plant operation costs is driven primarily by an increase in security costs and regulatory fees,
resulting from new NRC requirements.
● Lower consulting costs are primarily the result of cost management initiatives achieved throughout 2009.
● Lower uncollectible receivable costs are mainly due to improved collections and a decrease in natural gas prices.
Conservation and DSM Program Expenses — Conservation and DSM program expenses increased by approximately $57.7
million for 2010 compared with 2009, and by approximately $64.4 million for 2009 compared with 2008. The higher expense is
attributable to the continued expansion of programs and regulatory commitments. Conservation and DSM program expenses are
generally recovered in our major jurisdictions concurrently through riders and base rates. Overall, the programs are designed to
encourage the operating companies and their retail customers to conserve energy or change energy usage patterns in order to
reduce peak demand on the gas or electric system. This, in turn, reduces the need for additional plant capacity, reduces emissions,
serves to achieve other environmental goals as well as reduces energy costs to participating customers.