Xcel Energy 2010 Annual Report Download - page 125
Download and view the complete annual report
Please find page 125 of the 2010 Xcel Energy annual report below. You can navigate through the pages in the report by either clicking on the pages listed below, or by using the keyword search tool below to find specific information within the annual report.-
 1
1 -
2
-
3
-
4
-
5
-
6
-
7
-
8
-
9
-
10
-
11
-
12
-
13
-
14
-
15
-
16
-
17
-
18
-
19
-
20
-
21
-
22
-
23
-
24
-
25
-
26
-
27
-
28
-
29
-
30
-
31
-
32
-
33
-
34
-
35
-
36
-
37
-
38
-
39
-
40
-
41
-
42
-
43
-
44
-
45
-
46
-
47
-
48
-
49
-
50
-
51
-
52
-
53
-
54
-
55
-
56
-
57
-
58
-
59
-
60
-
61
-
62
-
63
-
64
-
65
-
66
-
67
-
68
-
69
-
70
-
71
-
72
-
73
-
74
-
75
-
76
-
77
-
78
-
79
-
80
-
81
-
82
-
83
-
84
-
85
-
86
-
87
-
88
-
89
-
90
-
91
-
92
-
93
-
94
-
95
-
96
-
97
-
98
-
99
-
100
-
101
-
102
-
103
-
104
-
105
-
106
-
107
-
108
-
109
-
110
-
111
-
112
-
113
-
114
-
 115
115 -
 116
116 -
 117
117 -
 118
118 -
 119
119 -
 120
120 -
 121
121 -
 122
122 -
 123
123 -
 124
124 -
 125
125 -
 126
126 -
 127
127 -
 128
128 -
 129
129 -
 130
130 -
 131
131 -
 132
132 -
 133
133 -
 134
134 -
 135
135 -
136
-
137
-
138
-
139
-
140
-
141
-
142
-
143
-
144
-
145
-
146
-
147
-
148
-
149
-
150
-
151
-
152
-
153
-
154
-
155
-
156
-
157
-
158
-
159
-
160
-
161
-
162
-
163
-
164
-
165
-
166
-
167
-
168
-
169
-
170
-
171
-
172
 |
 |

115
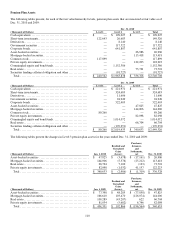
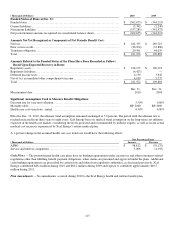
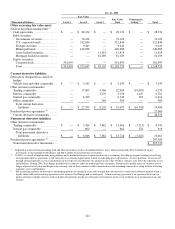
(Thousands of Dollars) 2010 2009
Funded Status of Plans at Dec. 31:
Funded status ........................................................................ $ (362,675) $ (344,213)
Current liabilities ..................................................................... (5,392) (2,240)
N
oncurrent liabilities ................................................................. (357,283) (341,973)
N
et postretirement amounts recognized on consolidated balance sheets.................... $ (362,675) $ (344,213)
Amounts Not Yet Recognized as Components of Net Periodic Benefit Cost:
N
et loss .............................................................................. $ 221,335 $ 189,743
Prior service credit .................................................................... (28,954) (33,886)
Transition obligation .................................................................. 29,591 44,035
Total ................................................................................ $ 221,972 $ 199,892
Amounts Related to the Funded Status of the Plans Have Been Recorded as Follows
Based Upon Expected Recovery in Rates:
Regulatory assets ..................................................................... $ 218,177 $ 190,172
Regulatory liabilities .................................................................. (6,423)
—
Deferred income taxes ................................................................ 4,159 3,943
N
e
t
-of-tax accumulated other comprehensive income.................................... 6,059 5,777
Total ................................................................................ $ 221,972 $ 199,892
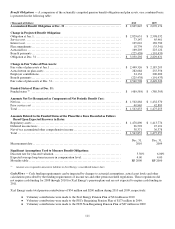
Measurement date .................................................................... Dec. 31,
2010 Dec. 31,
2009
Significant Assumptions Used to Measure Benefit Obligations:
Discount rate for year-end valuation.................................................... 5.50% 6.00
%
Mortality table ....................................................................... RP 2000 RP 2000
Health care costs trend rate - initial..................................................... 6.50% 6.80
%
Effective Dec. 31, 2010, the ultimate trend assumption remained unchanged at 5.0 percent. The period until the ultimate rate is
reached increased from three years to eight years. Xcel Energy bases its medical trend assumption on the long-term cost inflation
expected in the health care market, considering the levels projected and recommended by industry experts, as well as recent actual
medical cost increases experienced by Xcel Energy’s retiree medical plan.
A 1-percent change in the assumed health care cost trend rate would have the following effects:
One Percentage Point
(Thousands of Dollars) Increase Decrease
APBO ..............................................................................
.
$ 98,812 $ (76,175)
Service and interest components ......................................................
.
5,006 (4,193)
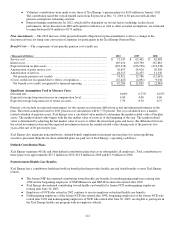
Cash Flows — The postretirement health care plans have no funding requirements under income tax and other retirement-related
regulations other than fulfilling benefit payment obligations, when claims are presented and approved under the plans. Additional
cash funding requirements are prescribed by certain state and federal rate regulatory authorities, as discussed previously. Xcel
Energy contributed $48.4 million during 2010 and $62.2 million during 2009 and expects to contribute approximately $40.5
million during 2011.
Plan Amendments — No amendments occurred during 2010 to the Xcel Energy health and welfare benefit plan.