Xcel Energy 2010 Annual Report Download - page 58
Download and view the complete annual report
Please find page 58 of the 2010 Xcel Energy annual report below. You can navigate through the pages in the report by either clicking on the pages listed below, or by using the keyword search tool below to find specific information within the annual report.-
 1
1 -
2
-
3
-
4
-
5
-
6
-
7
-
8
-
9
-
10
-
11
-
12
-
13
-
14
-
15
-
16
-
17
-
18
-
19
-
20
-
21
-
22
-
23
-
24
-
25
-
26
-
27
-
28
-
29
-
30
-
31
-
32
-
33
-
34
-
35
-
36
-
37
-
38
-
39
-
40
-
41
-
42
-
43
-
44
-
45
-
46
-
47
-
 48
48 -
 49
49 -
 50
50 -
 51
51 -
 52
52 -
 53
53 -
 54
54 -
 55
55 -
 56
56 -
 57
57 -
 58
58 -
 59
59 -
 60
60 -
 61
61 -
 62
62 -
 63
63 -
 64
64 -
 65
65 -
 66
66 -
 67
67 -
 68
68 -
69
-
70
-
71
-
72
-
73
-
74
-
75
-
76
-
77
-
78
-
79
-
80
-
81
-
82
-
83
-
84
-
85
-
86
-
87
-
88
-
89
-
90
-
91
-
92
-
93
-
94
-
95
-
96
-
97
-
98
-
99
-
100
-
101
-
102
-
103
-
104
-
105
-
106
-
107
-
108
-
109
-
110
-
111
-
112
-
113
-
114
-
115
-
116
-
117
-
118
-
119
-
120
-
121
-
122
-
123
-
124
-
125
-
126
-
127
-
128
-
129
-
130
-
131
-
132
-
133
-
134
-
135
-
136
-
137
-
138
-
139
-
140
-
141
-
142
-
143
-
144
-
145
-
146
-
147
-
148
-
149
-
150
-
151
-
152
-
153
-
154
-
155
-
156
-
157
-
158
-
159
-
160
-
161
-
162
-
163
-
164
-
165
-
166
-
167
-
168
-
169
-
170
-
171
-
172
 |
 |

48
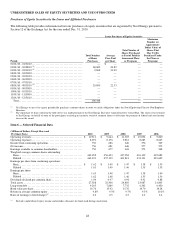
UNREGISTERED SALES OF EQUITY SECURITIES AND USE OF PROCEEDS
Purchases of Equity Securities by the Issuer and Affiliated Purchasers
The following table provides information about our purchases of equity securities that are registered by Xcel Energy pursuant to
Section 12 of the Exchange Act for the year ended Dec. 31, 2010:
Issuer Purchases of Equity Securities
Period
Total Number
of Share
Purchases
Average
Price Paid
per Share
Total Number of
Shares Purchased
as Part of Publicly
Announced Plans
or Programs
Maximum
Number (or
Approximate
Dollar Value) of
Shares That
May Yet Be
Purchased Under
the Plans or
Programs
01/01/10 - 01/31/10 ........................................
—
$—
—
—
02/01/10 - 02/28/10
(
a
)
...................................... 68,685 20.89
—
—
03/01/10 - 03/31/10
(b)
..................................... 9,868 21.00
—
—
04/01/10 - 04/30/10 ........................................
—
—
—
—
05/01/10 - 05/31/10 ........................................
—
—
—
—
06/01/10 - 06/30/10 ........................................
—
—
—
—
07/01/10 - 07/31/10 ........................................
—
—
—
—
08/01/10 - 08/31/10
(
a
)
...................................... 29,895 22.33
—
—
09/01/10 - 09/30/10 ........................................
—
—
—
—
10/01/10 - 10/31/10 ........................................
—
—
—
—
11/01/10 - 11/30/10 ........................................
—
—
—
—
12/01/10 - 12/31/10 ........................................
—
—
—
—
Total .................................................. 108,448
—
—
(a) Xcel Energy or one of its agents periodically purchases common shares in order to satisfy obligations under the Stock Equivalent Plan for Non-Employee
Directors.
(b) The repurchase of shares noted in the table above was made pursuant to the Xcel Energy Executive Annual Incentive Award Plan. The shares were returned
to Xcel Energy on behalf of some of the participants receiving an incentive award of common shares to effectuate the payment of federal and state income
taxes on the award.
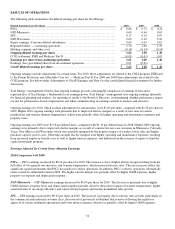
Item 6 — Selected Financial Data
(Millions of Dollars, Except Share and
Per Share Data) 2010 2009 2008 2007 2006
Operating revenues ........................................ $ 10,311 $ 9,644 $ 11,203 $ 10,034 $ 9,840
Operating expenses ........................................ 8,691 8,176 9,812 8,683 8,663
Income from continuing operations ........................... 752 686 646 576 569
N
et income............................................... 756 681 646 577 572
Earnings available to common shareholders .................... 752 677 641 573 568
Weighted average common shares outstanding:
Basic .................................................. 462,052 456,433 437,054 416,139 405,689
Diluted ................................................ 463,391 457,139 441,813 433,131 429,605
Earnings per share from continuing operations:
Basic .................................................. $ 1.62 $ 1.49 $ 1.47 $ 1.38 $ 1.39
Diluted ................................................ 1.61 1.49 1.46 1.35 1.35
Earnings per share:
Basic .................................................. 1.63 1.48 1.47 1.38 1.40
Diluted ................................................ 1.62 1.48 1.46 1.35 1.36
Dividends declared per common share ........................ 1.00 0.97 0.94 0.91 0.88
Total assets .............................................. 27,388 25,306 24,805 23,087 21,805
Long-term debt ........................................... 9,263 7,889 7,732 6,342 6,450
Book value per share ....................................... 16.76 15.92 15.35 14.70 14.28
Return on average common equity ........................... 9.8% 9.5% 9.7% 9.5% 10.1
%
Ratio of earnings to fixed charges
(
a
)
.......................... 2.6 2.5 2.5 2.2 2.2
(a) Excludes undistributed equity income and includes allowance for funds used during construction.