Xcel Energy 2010 Annual Report Download - page 133
Download and view the complete annual report
Please find page 133 of the 2010 Xcel Energy annual report below. You can navigate through the pages in the report by either clicking on the pages listed below, or by using the keyword search tool below to find specific information within the annual report.-
 1
1 -
2
-
3
-
4
-
5
-
6
-
7
-
8
-
9
-
10
-
11
-
12
-
13
-
14
-
15
-
16
-
17
-
18
-
19
-
20
-
21
-
22
-
23
-
24
-
25
-
26
-
27
-
28
-
29
-
30
-
31
-
32
-
33
-
34
-
35
-
36
-
37
-
38
-
39
-
40
-
41
-
42
-
43
-
44
-
45
-
46
-
47
-
48
-
49
-
50
-
51
-
52
-
53
-
54
-
55
-
56
-
57
-
58
-
59
-
60
-
61
-
62
-
63
-
64
-
65
-
66
-
67
-
68
-
69
-
70
-
71
-
72
-
73
-
74
-
75
-
76
-
77
-
78
-
79
-
80
-
81
-
82
-
83
-
84
-
85
-
86
-
87
-
88
-
89
-
90
-
91
-
92
-
93
-
94
-
95
-
96
-
97
-
98
-
99
-
100
-
101
-
102
-
103
-
104
-
105
-
106
-
107
-
108
-
109
-
110
-
111
-
112
-
113
-
114
-
115
-
116
-
117
-
118
-
119
-
120
-
121
-
122
-
 123
123 -
 124
124 -
 125
125 -
 126
126 -
 127
127 -
 128
128 -
 129
129 -
 130
130 -
 131
131 -
 132
132 -
 133
133 -
 134
134 -
 135
135 -
 136
136 -
 137
137 -
 138
138 -
 139
139 -
 140
140 -
 141
141 -
 142
142 -
 143
143 -
144
-
145
-
146
-
147
-
148
-
149
-
150
-
151
-
152
-
153
-
154
-
155
-
156
-
157
-
158
-
159
-
160
-
161
-
162
-
163
-
164
-
165
-
166
-
167
-
168
-
169
-
170
-
171
-
172
 |
 |

123
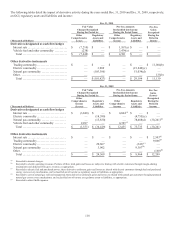
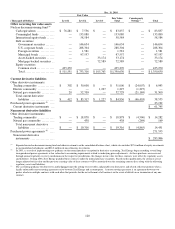
The methods utilized to measure the fair value of commodity derivatives include the use of forward prices and volatilities to value
commodity forwards and options. Levels are assigned to these fair value measurements based on the significance of the use of
subjective forward price and volatility forecasts for commodities and delivery locations with limited observability, or the
significance of contractual settlements that extend to periods beyond those readily observable on active exchanges or quoted by
brokers. Electric commodity derivatives include FTRs, for which fair value is determined using complex predictive models and
inputs including forward commodity prices as well as subjective forecasts of retail and wholesale demand, generation and
resulting transmission system congestion. Given the limited observability of management’s forecasts for several of these inputs,
fair value measurements for FTRs have been assigned a Level 3.
Xcel Energy continuously monitors the creditworthiness of the counterparties to its commodity derivative contracts and assesses
each counterparty’s ability to perform on the transactions set forth in the contracts. Given this assessment, as well as an
assessment of the impact of Xcel Energy’s own credit risk when determining the fair value of commodity derivative liabilities, the
impact of considering credit risk was immaterial to the fair value of commodity derivative assets and liabilities presented in the
consolidated balance sheets.
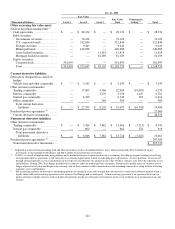
Cash equivalents are recorded at cost plus accrued interest to approximate fair value. Changes in the observed trading prices and
liquidity of cash equivalents, including money market funds, are also monitored as additional support for determining fair
value. Equity securities are valued using quoted prices in active markets. The fair values for commingled funds and international
equity funds are measured using net asset values, which take into consideration the value of underlying fund investments, as well
as the other accrued assets and liabilities of a fund, in order to determine a per share market value. The investments in
commingled funds and international equity funds may be redeemed for net asset value. Debt securities are primarily priced using
recent trades and observable spreads from benchmark interest rates for similar securities, except for asset-backed and mortgage-
backed securities, which also require significant, subjective risk-based adjustments to the interest rate used to discount expected
future cash flows, which include estimated principal prepayments. Therefore, fair value measurements for asset-backed and
mortgage-backed securities have been assigned a Level 3.
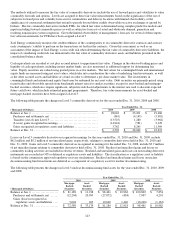
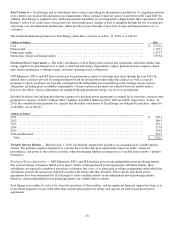
The following table presents the changes in Level 3 commodity derivatives for the years ended Dec. 31, 2010, 2009 and 2008:
Year Ended Dec. 31,
(Thousands of Dollars) 2010 2009 2008
Balance at Jan. 1 .................................................... $ 28,042 $ 23,221 $ 19,466
Purchases and settlements, net ..................................... (963) (4,143) (5,981)
Transfers (out of) into Level 3 ...................................... (13,525) 1,280 (3,962)
(Losses) gains recognized in earnings ............................... (14,924) (581) 2,129
Gains recognized as regulatory assets and liabilities .................. 3,762 8,265 11,569
Balance at Dec. 31 .................................................. $ 2,392 $ 28,042 $ 23,221
Losses on Level 3 commodity derivatives recognized in earnings for the years ended Dec. 31, 2010 and Dec. 31, 2009, include
$6.2 million and $8.2 million of net unrealized gains, respectively, relating to commodity derivatives held at Dec. 31, 2010 and
Dec. 31, 2009. Gains on Level 3 commodity derivatives recognized in earnings for the ended Dec. 31, 2008, include $3.7 million
of net unrealized gains relating to commodity derivatives held at Dec. 31, 2008. Realized and unrealized gains and losses on
commodity trading activities are included in electric revenues. Realized and unrealized gains and losses on non-trading derivative
instruments are recorded in OCI or deferred as regulatory assets and liabilities. The classification as a regulatory asset or liability
is based on the commission approved regulatory recovery mechanisms. Realized and unrealized gains and losses on nuclear
decommissioning fund investments are deferred as a component of a regulatory asset for nuclear decommissioning.
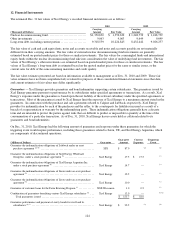
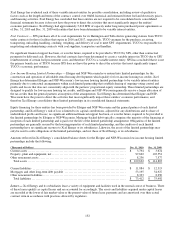
The following table presents the changes in Level 3 nuclear decommissioning fund assets for the years ended Dec. 31, 2010, 2009
and 2008:
Year Ended Dec. 31,
2010 2009 2008
(Thousands of Dollars)
Mortgage-
Backed
Securities
Asset-
Backed
Securities
Mortgage-
Backed
Securities
Asset-
Backed
Securities
Mortgage-
Backed
Securities
Asset-
Backed
Securities
Balance at Jan. 1 ..................... $ 81,189 $ 11,918 $ 98,461 $ 10,962 $ 100,802 $ 7,854
Purchases and settlements, net ...... (12,204) 20,993 (27,872) (484) 7,907 4,291
Gains (losses) recognized as
regulatory assets and liabilities .... 3,604 263 10,600 1,440 (10,248) (1,183)
Balance at Dec. 31 ................... $ 72,589 $ 33,174 $ 81,189 $ 11,918 $ 98,461 $ 10,962