Xcel Energy 2010 Annual Report Download - page 57
Download and view the complete annual report
Please find page 57 of the 2010 Xcel Energy annual report below. You can navigate through the pages in the report by either clicking on the pages listed below, or by using the keyword search tool below to find specific information within the annual report.-
 1
1 -
2
-
3
-
4
-
5
-
6
-
7
-
8
-
9
-
10
-
11
-
12
-
13
-
14
-
15
-
16
-
17
-
18
-
19
-
20
-
21
-
22
-
23
-
24
-
25
-
26
-
27
-
28
-
29
-
30
-
31
-
32
-
33
-
34
-
35
-
36
-
37
-
38
-
39
-
40
-
41
-
42
-
43
-
44
-
45
-
46
-
 47
47 -
 48
48 -
 49
49 -
 50
50 -
 51
51 -
 52
52 -
 53
53 -
 54
54 -
 55
55 -
 56
56 -
 57
57 -
 58
58 -
 59
59 -
 60
60 -
 61
61 -
 62
62 -
 63
63 -
 64
64 -
 65
65 -
 66
66 -
 67
67 -
68
-
69
-
70
-
71
-
72
-
73
-
74
-
75
-
76
-
77
-
78
-
79
-
80
-
81
-
82
-
83
-
84
-
85
-
86
-
87
-
88
-
89
-
90
-
91
-
92
-
93
-
94
-
95
-
96
-
97
-
98
-
99
-
100
-
101
-
102
-
103
-
104
-
105
-
106
-
107
-
108
-
109
-
110
-
111
-
112
-
113
-
114
-
115
-
116
-
117
-
118
-
119
-
120
-
121
-
122
-
123
-
124
-
125
-
126
-
127
-
128
-
129
-
130
-
131
-
132
-
133
-
134
-
135
-
136
-
137
-
138
-
139
-
140
-
141
-
142
-
143
-
144
-
145
-
146
-
147
-
148
-
149
-
150
-
151
-
152
-
153
-
154
-
155
-
156
-
157
-
158
-
159
-
160
-
161
-
162
-
163
-
164
-
165
-
166
-
167
-
168
-
169
-
170
-
171
-
172
 |
 |
47
Book value per share at Dec. 31, 2010, was $16.76. The number of common shareholders of record as of Dec. 31, 2010 was
approximately 79,461. The Articles of Incorporation of Xcel Energy place restrictions on the amount of common stock dividends
it can pay when preferred stock is outstanding. Under the provisions, dividend payments may be restricted if Xcel Energy’s
capitalization ratio (on a holding company basis only, not on a consolidated basis) is less than 25 percent. For these purposes, the
capitalization ratio is equal to (i) common stock plus surplus divided by (ii) the sum of common stock plus surplus plus long-term
debt. Based on this definition, Xcel Energy’s holding company capitalization ratio at Dec. 31, 2010 and 2009 was 84 percent and
85 percent, respectively. Therefore, the restrictions do not place any effective limit on Xcel Energy’s ability to pay dividends. See
Item 7 and Note 7 to the consolidated financial statements for further discussion of Xcel Energy’s dividend policy.
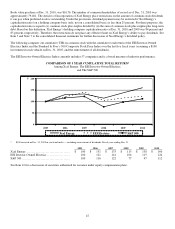
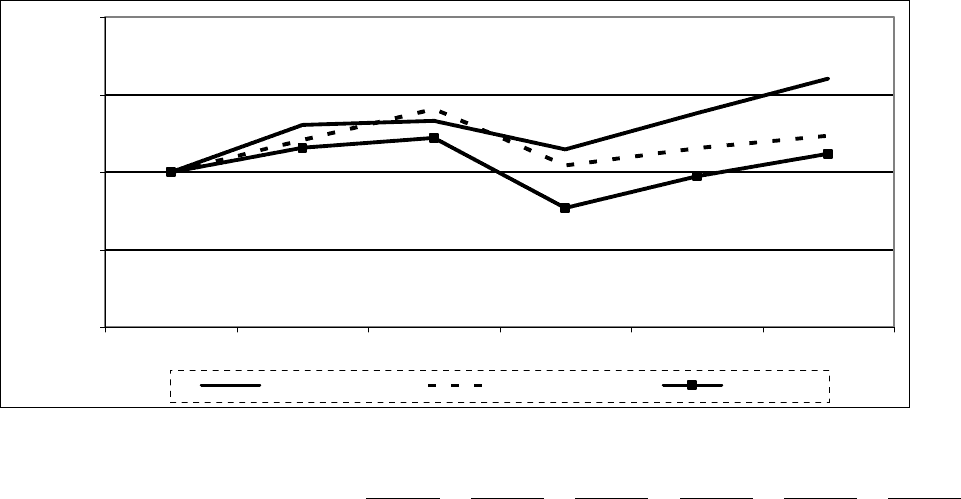
The following compares our cumulative TSR on common stock with the cumulative total return of the EEI Investor-Owned
Electrics Index and the Standard & Poor’s 500 Composite Stock Price Index over the last five fiscal years (assuming a $100
investment in each vehicle on Dec. 31, 2005, and the reinvestment of all dividends).
The EEI Investor-Owned Electrics Index currently includes 57 companies and is a broad measure of industry performance.
COMPARISON OF 5 YEAR CUMULATIVE TOTAL RETURN*
Among Xcel Energy, The EEI Investor-Owned Electrics,
and The S&P 500
0
50
100
150
200
2005 2006 2007 2008 2009 2010
$
Xcel Energy EEI Electrics S&P 500
* $100 invested on Dec. 31, 2005 in stock and index — including reinvestment of dividends. Fiscal years ending Dec. 31.
2005 2006 2007 2008 2009 2010
Xcel Energy ................................... $ 100 $ 131 $ 133 $ 115 $ 138 $ 160
EEI Investor-Owned Electrics .................. 100 121 141 104 115 124
S&P 500 ...................................... 100 116 122 77 97 112
See Item 12 for a discussion of securities authorized for issuance under equity compensation plans.