Xcel Energy 2010 Annual Report Download - page 166
Download and view the complete annual report
Please find page 166 of the 2010 Xcel Energy annual report below. You can navigate through the pages in the report by either clicking on the pages listed below, or by using the keyword search tool below to find specific information within the annual report.-
 1
1 -
2
-
3
-
4
-
5
-
6
-
7
-
8
-
9
-
10
-
11
-
12
-
13
-
14
-
15
-
16
-
17
-
18
-
19
-
20
-
21
-
22
-
23
-
24
-
25
-
26
-
27
-
28
-
29
-
30
-
31
-
32
-
33
-
34
-
35
-
36
-
37
-
38
-
39
-
40
-
41
-
42
-
43
-
44
-
45
-
46
-
47
-
48
-
49
-
50
-
51
-
52
-
53
-
54
-
55
-
56
-
57
-
58
-
59
-
60
-
61
-
62
-
63
-
64
-
65
-
66
-
67
-
68
-
69
-
70
-
71
-
72
-
73
-
74
-
75
-
76
-
77
-
78
-
79
-
80
-
81
-
82
-
83
-
84
-
85
-
86
-
87
-
88
-
89
-
90
-
91
-
92
-
93
-
94
-
95
-
96
-
97
-
98
-
99
-
100
-
101
-
102
-
103
-
104
-
105
-
106
-
107
-
108
-
109
-
110
-
111
-
112
-
113
-
114
-
115
-
116
-
117
-
118
-
119
-
120
-
121
-
122
-
123
-
124
-
125
-
126
-
127
-
128
-
129
-
130
-
131
-
132
-
133
-
134
-
135
-
136
-
137
-
138
-
139
-
140
-
141
-
142
-
143
-
144
-
145
-
146
-
147
-
148
-
149
-
150
-
151
-
152
-
153
-
154
-
155
-
 156
156 -
 157
157 -
 158
158 -
 159
159 -
 160
160 -
 161
161 -
 162
162 -
 163
163 -
 164
164 -
 165
165 -
 166
166 -
 167
167 -
 168
168 -
 169
169 -
 170
170 -
 171
171 -
 172
172
 |
 |

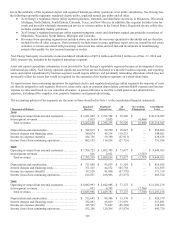
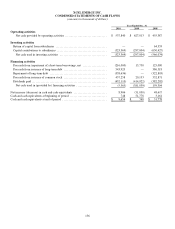
156
XCEL ENERGY INC.
CONDENSED STATEMENTS OF CASH FLOWS
(amounts in thousands of dollars)
Year Ended Dec. 31
2010 2009 2008
Operating activities
Net cash provided by operating activities ................................. $ 537,840 $ 627,013 $ 455,387
Investing activities
Return of capital from subsidiaries ........................................
—
—
64,353
Capital contributions to subsidiaries ....................................... (523,369) (297,004) (630,427)
Net cash used in investing activities ..................................... (523,369) (297,004) (566,074)
Financing activities
Proceeds from (repayment of) short-term borrowings, net ................... (216,000) 13,750 125,000
Proceeds from issuance of long-term debt .................................. 543,923
—
386,518
Repayment of long-term debt ............................................. (358,636)
—
(322,803)
Proceeds from issuance of common stock .................................. 457,258 20,133 352,871
Dividends paid ........................................................... (432,110) (414,922) (382,282)
Net cash used in (provided by) financing activities ........................ (5,565) (381,039) 159,304
N
et increase (decrease) in cash and cash equivalents .......................... 8,906 (51,030) 48,617
Cash and cash equivalents at beginning of period ............................. 748 51,778 3,161
Cash and cash equivalents at end of period ................................... $ 9,654 $ 748 $ 51,778