Xcel Energy 2010 Annual Report Download - page 68
Download and view the complete annual report
Please find page 68 of the 2010 Xcel Energy annual report below. You can navigate through the pages in the report by either clicking on the pages listed below, or by using the keyword search tool below to find specific information within the annual report.-
 1
1 -
2
-
3
-
4
-
5
-
6
-
7
-
8
-
9
-
10
-
11
-
12
-
13
-
14
-
15
-
16
-
17
-
18
-
19
-
20
-
21
-
22
-
23
-
24
-
25
-
26
-
27
-
28
-
29
-
30
-
31
-
32
-
33
-
34
-
35
-
36
-
37
-
38
-
39
-
40
-
41
-
42
-
43
-
44
-
45
-
46
-
47
-
48
-
49
-
50
-
51
-
52
-
53
-
54
-
55
-
56
-
57
-
 58
58 -
 59
59 -
 60
60 -
 61
61 -
 62
62 -
 63
63 -
 64
64 -
 65
65 -
 66
66 -
 67
67 -
 68
68 -
 69
69 -
 70
70 -
 71
71 -
 72
72 -
 73
73 -
 74
74 -
 75
75 -
 76
76 -
 77
77 -
 78
78 -
79
-
80
-
81
-
82
-
83
-
84
-
85
-
86
-
87
-
88
-
89
-
90
-
91
-
92
-
93
-
94
-
95
-
96
-
97
-
98
-
99
-
100
-
101
-
102
-
103
-
104
-
105
-
106
-
107
-
108
-
109
-
110
-
111
-
112
-
113
-
114
-
115
-
116
-
117
-
118
-
119
-
120
-
121
-
122
-
123
-
124
-
125
-
126
-
127
-
128
-
129
-
130
-
131
-
132
-
133
-
134
-
135
-
136
-
137
-
138
-
139
-
140
-
141
-
142
-
143
-
144
-
145
-
146
-
147
-
148
-
149
-
150
-
151
-
152
-
153
-
154
-
155
-
156
-
157
-
158
-
159
-
160
-
161
-
162
-
163
-
164
-
165
-
166
-
167
-
168
-
169
-
170
-
171
-
172
 |
 |

58
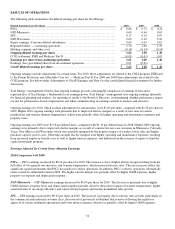
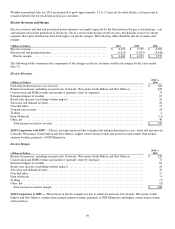
Statement of Income Analysis
The following discussion summarizes the items that affected the individual revenue and expense items reported in the
consolidated statements of income.
Estimated Impact of Temperature Changes on Regulated Earnings — Unseasonably hot summers or cold winters increase
electric and natural gas sales while, conversely, mild weather reduces electric and natural gas sales. The estimated impact of
weather on earnings is based on the number of customers, temperature variances and the amount of natural gas or electricity the
average customer historically uses per degree of temperature. Accordingly, deviations in weather from normal levels can affect
Xcel Energy’s financial performance.
Degree-day or Temperature-Humidity Index (THI) data is used to estimate amounts of energy required to maintain comfortable
indoor temperature levels based on each day’s average temperature and humidity. Heating degree-days (HDD) is the measure of
the variation in the weather based on the extent to which the average daily temperature falls below 65° Fahrenheit, and cooling
degree-days (CDD) is the measure of the variation in the weather based on the extent to which the average daily temperature rises
above 65° Fahrenheit. Each degree of temperature above 65° Fahrenheit is counted as one cooling degree-day, and each degree of
temperature below 65° Fahrenheit is counted as one heating degree-day. In Xcel Energy’s more humid service territories, a THI is
used in place of CDD, which adds a humidity factor to CDD. HDD, CDD and THI are most likely to impact the usage of Xcel
Energy’s residential and commercial customers. Industrial customers are less weather sensitive.
Normal weather conditions are defined as either the 20-year or 30-year average of actual historical weather conditions. The
historical period of time used in the calculation of normal weather differs by jurisdiction based on the time period used by the
regulator in establishing estimated volumes in the rate setting process. The percentage increase (decrease) in normal and actual
HDD, CDD and THI are provided in the following table:
2010 vs. Normal 2009 vs. Normal 2010 vs. 2009 2008 vs. Normal 2009 vs. 2008
HDD ..............................
.
(4.7)% 0.4% (5.0)% 4.5% (3.9)%
CDD ..............................
.
10.8 (10.5) 23.8 1.0 (11.4)
THI ...............................
.
27.8 (34.5) 95.1 (15.5) (22.5)
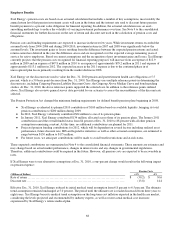
Weather — The following table summarizes the estimated impact on earnings per share of temperature variations compared with
sales under normal weather conditions.
2010 vs. Normal 2009 vs. Normal 2010 vs. 2009 2008 vs. Normal 2009 vs. 2008
Retail electric ......................
.
$ 0.04 $ (0.05) $ 0.09 $ (0.01) $ (0.04)
Firm natural gas ...................
.
(0.01)
—
(0.01) 0.01 (0.01)
Total ............................
.
$ 0.03 $ (0.05) $ 0.08 $
—
$ (0.05)
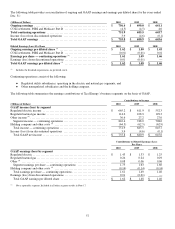
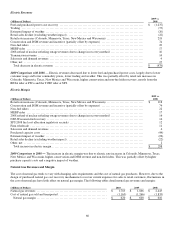
Sales Growth (Decline) — The following table summarizes Xcel Energy’s regulated sales growth (decline) for actual and
weather-normalized energy sales for the years ended Dec. 31, compared with the previous year.
Dec. 31, 2010 Dec. 31, 2009
Actual Weather
Normalized
Weather
Normalized
Lubbock (a) Actual Weather
Normalized
Electric residential ............................ 4.6% 0.7% 0.9% (1.4)% 0.7
%
Electric commercial and industrial .............. 2.6 1.4 1.6 (3.3) (2.7)
Total retail electric sales ..................... 3.1 1.2 1.4 (2.7) (1.8)
Firm natural gas sales ......................... (2.9) (0.2)
N
/A (2.6) 0.1
(a) Adjusted for the October 2010 sale of SPS electric distribution assets to the city of Lubbock, Texas.
During 2009, we experienced lower than anticipated actual electric residential sales, and a decline in electric commercial and
industrial sales on a weather-adjusted basis, which we believe was driven by overall economic conditions and to a lesser degree,
increased conservation efforts. Sales in 2010 for the commercial and industrial class have shown signs of recovery. We anticipate
that sales in the future will grow at a slower rate than historical levels, due in part to increased conservation activities.