Xcel Energy 2010 Annual Report Download - page 42
Download and view the complete annual report
Please find page 42 of the 2010 Xcel Energy annual report below. You can navigate through the pages in the report by either clicking on the pages listed below, or by using the keyword search tool below to find specific information within the annual report.
32
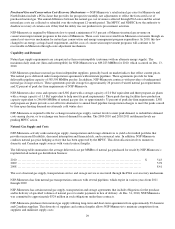
Natural Gas Supply and Costs
PSCo actively seeks natural gas supply, transportation and storage alternatives to yield a diversified portfolio that provides
increased flexibility, decreased interruption and financial risk, and economical rates. In addition, PSCo conducts natural gas price
hedging activities that have been approved by the CPUC. This diversification involves numerous supply sources with varied
contract lengths.
The following table summarizes the average delivered cost per MMBtu of natural gas purchased for resale by PSCo’s regulated
retail natural gas distribution business:
2010 ................................................................................................
.
$5.10
2009 ................................................................................................
.
5.13
2008 ................................................................................................
.
7.04
PSCo has natural gas supply, transportation and storage agreements that include obligations for the purchase and/or delivery of
specified volumes of natural gas or to make payments in lieu of delivery. At Dec. 31, 2010, PSCo was committed to
approximately $1.1 billion in such obligations under these contracts, which expire in various years from 2011 through 2029.
PSCo purchases natural gas by optimizing a balance of long-term and short-term natural gas purchases, firm transportation and
natural gas storage contracts. During 2010, PSCo purchased natural gas from approximately 41 suppliers.
SPS
Natural Gas Facilities Used for Electric Generation
SPS does not provide natural gas service at retail, but purchases and transports natural gas for certain of its generation facilities
and operates natural gas pipeline facilities connecting the generation facilities to interstate natural gas pipelines. SPS is subject to
the jurisdiction of the FERC with respect to certain natural gas transactions in interstate commerce; and to the jurisdiction of the
DOT and the PUCT for pipeline safety compliance.
See Item 7 for further discussion of natural gas costs.
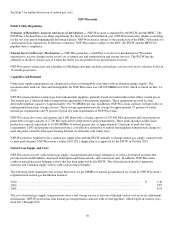
Natural Gas Operating Statistics
Year Ended Dec. 31,
2010 2009 2008
Natural gas deliveries (Thousands of MMBtu)
Residential ......................................................... 137,809 141,719 145,615
Commercial and industrial ............................................ 87,599 88,943 92,682
Total retail ...................................................... 225,408 230,662 238,297
Transportation and other .............................................. 121,261 126,993 133,207
Total deliveries .................................................. 346,669 357,655 371,504
Number of customers at end of period
Residential ......................................................... 1,735,032 1,723,419 1,712,835
Commercial and industrial ............................................ 152,937 152,312 151,731
Total retail ...................................................... 1,887,969 1,875,731 1,864,566
Transportation and other .............................................. 5,281 4,826 4,350
Total customers .................................................. 1,893,250 1,880,557 1,868,916
Natural gas revenues (Thousands of Dollars)
Residential ......................................................... $ 1,115,253 $ 1,159,079 $ 1,496,772
Commercial and industrial ............................................ 589,449 631,728 872,224
Total retail ...................................................... 1,704,702 1,790,807 2,368,996
Transportation and other .............................................. 77,880 74,896 73,992
Total natural gas revenues......................................... $ 1,782,582 $ 1,865,703 $ 2,442,988
MMBtu sales per retail customer ....................................... 119.39 122.97 127.80
Revenue per retail customer ........................................... $ 903 $ 955 $ 1,271
Residential revenue per MMBtu ....................................... 8.09¢ 8.18¢ 10.28¢
Commercial and industrial revenue per MMBtu .......................... 6.73 7.10 9.41
Transportation and other revenue per MMBtu ............................ 0.64 0.59 0.56


