Xcel Energy 2010 Annual Report Download - page 120
Download and view the complete annual report
Please find page 120 of the 2010 Xcel Energy annual report below. You can navigate through the pages in the report by either clicking on the pages listed below, or by using the keyword search tool below to find specific information within the annual report.-
 1
1 -
2
-
3
-
4
-
5
-
6
-
7
-
8
-
9
-
10
-
11
-
12
-
13
-
14
-
15
-
16
-
17
-
18
-
19
-
20
-
21
-
22
-
23
-
24
-
25
-
26
-
27
-
28
-
29
-
30
-
31
-
32
-
33
-
34
-
35
-
36
-
37
-
38
-
39
-
40
-
41
-
42
-
43
-
44
-
45
-
46
-
47
-
48
-
49
-
50
-
51
-
52
-
53
-
54
-
55
-
56
-
57
-
58
-
59
-
60
-
61
-
62
-
63
-
64
-
65
-
66
-
67
-
68
-
69
-
70
-
71
-
72
-
73
-
74
-
75
-
76
-
77
-
78
-
79
-
80
-
81
-
82
-
83
-
84
-
85
-
86
-
87
-
88
-
89
-
90
-
91
-
92
-
93
-
94
-
95
-
96
-
97
-
98
-
99
-
100
-
101
-
102
-
103
-
104
-
105
-
106
-
107
-
108
-
109
-
 110
110 -
 111
111 -
 112
112 -
 113
113 -
 114
114 -
 115
115 -
 116
116 -
 117
117 -
 118
118 -
 119
119 -
 120
120 -
 121
121 -
 122
122 -
 123
123 -
 124
124 -
 125
125 -
 126
126 -
 127
127 -
 128
128 -
 129
129 -
 130
130 -
131
-
132
-
133
-
134
-
135
-
136
-
137
-
138
-
139
-
140
-
141
-
142
-
143
-
144
-
145
-
146
-
147
-
148
-
149
-
150
-
151
-
152
-
153
-
154
-
155
-
156
-
157
-
158
-
159
-
160
-
161
-
162
-
163
-
164
-
165
-
166
-
167
-
168
-
169
-
170
-
171
-
172
 |
 |

110
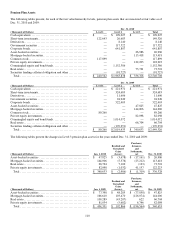
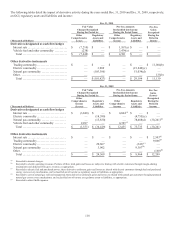
Pension Plan Assets
The following tables present, for each of the fair value hierarchy Levels, pension plan assets that are measured at fair value as of
Dec. 31, 2010 and 2009:
Dec. 31, 2010
(Thousands of Dollars) Level 1 Level 2 Level 3 Total
Cash equivalents ............................................ $
—
$ 109,027 $
—
$109,027
Short-term investments....................................... 122,643 26,683
—
149,326
Derivatives..................................................
—
8,140
—
8,140
Government securities .......................................
—
117,522
—
117,522
Corporate bonds .............................................
—
641,807
—
641,807
Asset-backed securities ......................................
—
—
26,986 26,986
Mortgage-backed securities ...................................
—
—
113,418 113,418
Common stock .............................................. 117,899
—
—
117,899
Private equity investments ....................................
—
—
122,223 122,223
Commingled equity and bond funds...........................
—
1,152,386
—
1,152,386
Real estate ..................................................
—
—
73,701 73,701
Securities lending collateral obligation and other ...............
—
(91,727)
—
(91,727)
Total ..................................................... $ 240,542 $ 1,963,838 $ 336,328 $ 2,540,708
Dec. 31, 2009
(Thousands of Dollars) Level 1 Level 2 Level 3 Total
Cash equivalents ............................................ $
—
$ 221,971 $
—
$221,971
Short-term investments.......................................
—
324,683
—
324,683
Derivatives..................................................
—
11,606
—
11,606
Government securities .......................................
—
94,949
—
94,949
Corporate bonds .............................................
—
522,403
—
522,403
Asset-backed securities ......................................
—
—
47,825 47,825
Mortgage-backed securities ...................................
—
—
144,006 144,006
Common stock .............................................. 89,260
—
—
89,260
Private equity investments ....................................
—
—
82,098 82,098
Commingled equity and bond funds...........................
—
1,014,072
—
1,014,072
Real estate ..................................................
—
—
66,704 66,704
Securities lending collateral obligation and other ...............
—
(170,251)
—
(170,251)
Total ..................................................... $ 89,260 $ 2,019,433 $ 340,633 $ 2,449,326
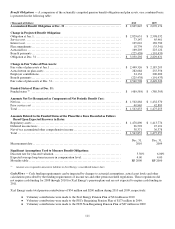
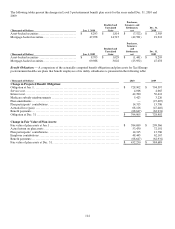
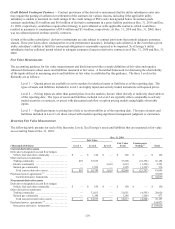
The following tables present the changes in Level 3 pension plan assets for the years ended Dec. 31, 2010 and 2009:
(Thousands of Dollars) Jan. 1, 2010
Realized and
Unrealized
Gains
(Losses)
Purchases,
Issuances,
and
Settlements,
net Dec. 31, 2010
Asset-backed securities ....................................... $ 47,825 $ (3,678) $ (17,161) $ 26,986
Mortgage-backed securities .................................... 144,006 (5,376) (25,212) 113,418
Real estate ................................................... 66,704 7,100 (103) 73,701
Private equity investments ..................................... 82,098 (1,032) 41,157 122,223
Total ...................................................... $ 340,633 $ (2,986) $ (1,319) $ 336,328
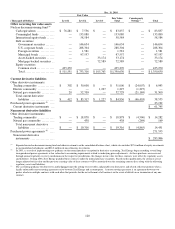
(Thousands of Dollars) Jan. 1, 2009
Realized and
Unrealized
Gains
(Losses)
Purchases,
Issuances,
and
Settlements,
net Dec. 31, 2009
Asset-backed securities ....................................... $ 77,398 $ 48,285 $ (77,858) $ 47,825
Mortgage-backed securities .................................... 166,610 103,470 (126,074) 144,006
Real estate ................................................... 109,289 (43,207) 622 66,704
Private equity investments ..................................... 81,034 (5,682) 6,746 82,098
Total ...................................................... $ 434,331 $ 102,866 $ (196,564) $ 340,633