Xcel Energy 2010 Annual Report Download - page 126
Download and view the complete annual report
Please find page 126 of the 2010 Xcel Energy annual report below. You can navigate through the pages in the report by either clicking on the pages listed below, or by using the keyword search tool below to find specific information within the annual report.-
 1
1 -
2
-
3
-
4
-
5
-
6
-
7
-
8
-
9
-
10
-
11
-
12
-
13
-
14
-
15
-
16
-
17
-
18
-
19
-
20
-
21
-
22
-
23
-
24
-
25
-
26
-
27
-
28
-
29
-
30
-
31
-
32
-
33
-
34
-
35
-
36
-
37
-
38
-
39
-
40
-
41
-
42
-
43
-
44
-
45
-
46
-
47
-
48
-
49
-
50
-
51
-
52
-
53
-
54
-
55
-
56
-
57
-
58
-
59
-
60
-
61
-
62
-
63
-
64
-
65
-
66
-
67
-
68
-
69
-
70
-
71
-
72
-
73
-
74
-
75
-
76
-
77
-
78
-
79
-
80
-
81
-
82
-
83
-
84
-
85
-
86
-
87
-
88
-
89
-
90
-
91
-
92
-
93
-
94
-
95
-
96
-
97
-
98
-
99
-
100
-
101
-
102
-
103
-
104
-
105
-
106
-
107
-
108
-
109
-
110
-
111
-
112
-
113
-
114
-
115
-
 116
116 -
 117
117 -
 118
118 -
 119
119 -
 120
120 -
 121
121 -
 122
122 -
 123
123 -
 124
124 -
 125
125 -
 126
126 -
 127
127 -
 128
128 -
 129
129 -
 130
130 -
 131
131 -
 132
132 -
 133
133 -
 134
134 -
 135
135 -
 136
136 -
137
-
138
-
139
-
140
-
141
-
142
-
143
-
144
-
145
-
146
-
147
-
148
-
149
-
150
-
151
-
152
-
153
-
154
-
155
-
156
-
157
-
158
-
159
-
160
-
161
-
162
-
163
-
164
-
165
-
166
-
167
-
168
-
169
-
170
-
171
-
172
 |
 |

116
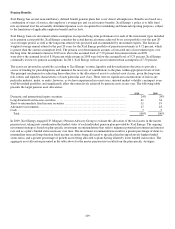
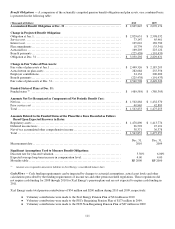
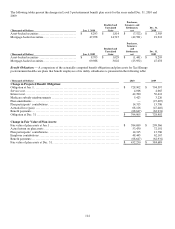
Benefit Costs — The components of net periodic postretirement benefit costs are:
(Thousands of Dollars) 2010 2009 2008
Service cost ......................................................... $ 4,006 $ 4,665 $ 5,350
Interest cost ......................................................... 42,780 50,412 51,047
Expected return on plan assets ........................................ (28,529) (22,775) (31,851)
Amortization of transition obligation .................................. 14,444 14,444 14,577
Amortization of prior service cost ..................................... (4,932) (2,726) (2,175)
Amortization of net loss .............................................. 11,643 19,329 11,498
Net periodic postretirement benefit cost ............................. 39,412 63,349 48,446
Additional cost recognized due to effects of regulation.................. 3,891 3,891 3,891
Net benefit cost recognized for financial reporting .................... $ 43,303 $ 67,240 $ 52,337
Significant Assumptions Used to Measure Costs:
Discount rate ........................................................ 6.00% 6.75% 6.25
%
Expected average long-term rate of return on assets (before tax) ......... 7.50 7.50 7.50
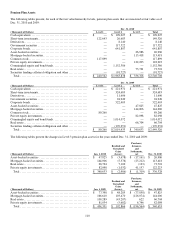
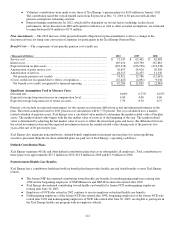
Projected Benefit Payments
The following table lists Xcel Energy’s projected benefit payments for the pension and postretirement benefit plans:
(Thousands of Dollars)
Projected
Pension
Benefit
Payments
Gross
Projected
Postretirement
Health Care
Benefit
Payments
Expected
Medicare
Part D
Subsidies
Net Projected
Postretirement
Health Care
Benefit
Payments
2011 ............................................... $ 254,426 $ 59,752 $ 4,770 $ 54,982
2012 ............................................... 247,156 60,230 5,126 55,104
2013 ............................................... 249,908 60,607 5,475 55,132
2014 ............................................... 257,886 61,833 5,773 56,060
2015 ............................................... 259,978 63,184 6,061 57,123
2016-2020 ......................................... 1,338,658 325,154 34,115 291,039
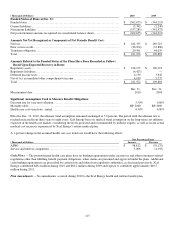
10. Other Income, Net
Other income (expense), net, for the years ended Dec. 31 consisted of the following:
(Thousands of Dollars) 2010 2009 2008
Interest income ...................................................... $ 11,023 $ 14,928 $ 29,753
COLI settlement (See Note 6) ........................................ 25,000
—
—
Other nonoperating income ........................................... 1,689 3,650 6,320
Insurance policy (expenses) income ................................... (6,529) (8,646) 4,337
Other nonoperating expenses ......................................... (40) (161) (4)
Other income, net .................................................. $ 31,143 $ 9,771 $ 40,406
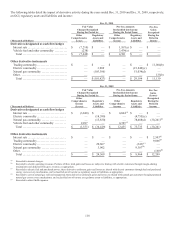
11. Derivative Instruments and Fair Value Measurements
Xcel Energy and its utility subsidiaries enter into derivative instruments, including forward contracts, futures, swaps and options,
for trading purposes and to reduce risk in connection with changes in interest rates, utility commodity prices and vehicle fuel
prices, as well as variances in forecasted weather.
Short-Term Wholesale and Commodity Trading Risk — Xcel Energy’s utility subsidiaries conduct various short-term wholesale
and commodity trading activities, including the purchase and sale of electric capacity, energy and energy-related instruments.
Xcel Energy’s risk management policy allows management to conduct these activities within guidelines and limitations as
approved by its risk management committee, which is made up of management personnel not directly involved in the activities
governed by this policy.