Xcel Energy 2010 Annual Report Download - page 127
Download and view the complete annual report
Please find page 127 of the 2010 Xcel Energy annual report below. You can navigate through the pages in the report by either clicking on the pages listed below, or by using the keyword search tool below to find specific information within the annual report.-
 1
1 -
2
-
3
-
4
-
5
-
6
-
7
-
8
-
9
-
10
-
11
-
12
-
13
-
14
-
15
-
16
-
17
-
18
-
19
-
20
-
21
-
22
-
23
-
24
-
25
-
26
-
27
-
28
-
29
-
30
-
31
-
32
-
33
-
34
-
35
-
36
-
37
-
38
-
39
-
40
-
41
-
42
-
43
-
44
-
45
-
46
-
47
-
48
-
49
-
50
-
51
-
52
-
53
-
54
-
55
-
56
-
57
-
58
-
59
-
60
-
61
-
62
-
63
-
64
-
65
-
66
-
67
-
68
-
69
-
70
-
71
-
72
-
73
-
74
-
75
-
76
-
77
-
78
-
79
-
80
-
81
-
82
-
83
-
84
-
85
-
86
-
87
-
88
-
89
-
90
-
91
-
92
-
93
-
94
-
95
-
96
-
97
-
98
-
99
-
100
-
101
-
102
-
103
-
104
-
105
-
106
-
107
-
108
-
109
-
110
-
111
-
112
-
113
-
114
-
115
-
116
-
 117
117 -
 118
118 -
 119
119 -
 120
120 -
 121
121 -
 122
122 -
 123
123 -
 124
124 -
 125
125 -
 126
126 -
 127
127 -
 128
128 -
 129
129 -
 130
130 -
 131
131 -
 132
132 -
 133
133 -
 134
134 -
 135
135 -
 136
136 -
 137
137 -
138
-
139
-
140
-
141
-
142
-
143
-
144
-
145
-
146
-
147
-
148
-
149
-
150
-
151
-
152
-
153
-
154
-
155
-
156
-
157
-
158
-
159
-
160
-
161
-
162
-
163
-
164
-
165
-
166
-
167
-
168
-
169
-
170
-
171
-
172
 |
 |

117
Interest Rate Derivatives — Xcel Energy and its utility subsidiaries enter into various instruments that effectively fix the interest
payments on certain floating rate debt obligations or effectively fix the yield or price on a specified benchmark interest rate for an
anticipated debt issuance for a specific period. These derivative instruments are generally designated as cash flow hedges for
accounting purposes.
At Dec. 31, 2010, accumulated OCI related to interest rate derivatives included $0.7 million of net losses expected to be
reclassified into earnings during the next 12 months as the related hedged interest rate transactions impact earnings.
During the fourth quarter of 2009, Xcel Energy settled a $25 million notional value interest rate swap at SPS. This interest rate
swap was not designated as a hedging instrument, and as such, gains and losses from changes in the fair value of the interest rate
swap were recorded to earnings.
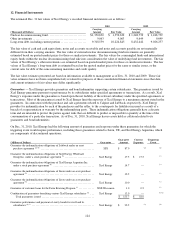
Commodity Derivatives — Xcel Energy’s utility subsidiaries enter into derivative instruments to manage variability of future cash
flows from changes in commodity prices in their electric and natural gas operations, as well as for trading purposes. This could
include the purchase or sale of energy or energy-related products, natural gas to generate electric energy, gas for resale and
vehicle fuel.
At Dec. 31, 2010, Xcel Energy had various vehicle fuel related contracts designated as cash flow hedges extending through
December 2014. Xcel Energy’s utility subsidiaries also enter into derivative instruments that mitigate commodity price risk on
behalf of electric and natural gas customers but are not designated as qualifying hedging transactions. Changes in the fair value of
non-trading commodity derivative instruments are recorded in OCI or deferred as a regulatory asset or liability. The classification
as a regulatory asset or liability is based on commission approved regulatory recovery mechanisms. Xcel Energy recorded
immaterial amounts to income related to the ineffectiveness of cash flow hedges for the years ended Dec. 31, 2010 and 2009.
At Dec. 31, 2010, accumulated OCI related commodity derivative cash flow hedges included $0.1 million of net gains expected to
be reclassified into earnings during the next 12 months as the hedged transactions occur.
Additionally, Xcel Energy’s utility subsidiaries enter into commodity derivative instruments for trading purposes not directly
related to commodity price risks associated with serving their electric and natural gas customers. Changes in the fair value of
these commodity derivatives are recorded in electric operating revenues, net of amounts credited to customers under margin-
sharing mechanisms.
The following table details the gross notional amounts of commodity forwards, options and FTRs at Dec. 31, 2010 and Dec. 31,
2009:
(Amounts in Thousands) (a)(b) Dec. 31, 2010 Dec. 31, 2009
MWh of electricity ................................................................... 46,794 37,932
MMBtu of natural gas ................................................................. 75,806 57,181
Gallons of vehicle fuel ................................................................ 800 3,580
(a) Amounts are not reflective of net positions in the underlying commodities.
(b) Notional amounts for options are included on a gross basis, but are weighted for the probability of exercise.
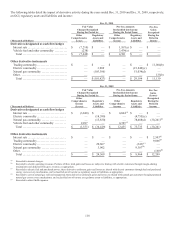
Financial Impact of Qualifying Cash Flow Hedges — The impact of qualifying interest rate and vehicle fuel cash flow hedges
on Xcel Energy’s accumulated OCI, included in the consolidated statements of common stockholders’ equity and comprehensive
income, is detailed in the following table:
(Thousands of Dollars) 2010 2009 2008
Accumulated other comprehensive loss related to cash flow hedges at Jan. 1......... $ (6,435) $ (13,113) $ (1,416)
After-tax net unrealized losses related to derivatives accounted for as hedges ........ (4,289) (710) (12,083)
After-tax net realized losses on derivative transactions reclassified into earnings ..... 2,630 7,388 386
Accumulated other comprehensive loss related to cash flow hedges at Dec. 31....... $ (8,094) $ (6,435) $ (13,113)
Xcel Energy had no derivative instruments designated as fair value hedges during the years ended Dec. 31, 2010 and Dec. 31,
2009. Therefore, no gains or losses from fair value hedges or related hedged transactions were recognized for these periods.