United Airlines 2011 Annual Report Download - page 97
Download and view the complete annual report
Please find page 97 of the 2011 United Airlines annual report below. You can navigate through the pages in the report by either clicking on the pages listed below, or by using the keyword search tool below to find specific information within the annual report.-
 1
1 -
2
-
3
-
4
-
5
-
6
-
7
-
8
-
9
-
10
-
11
-
12
-
13
-
14
-
15
-
16
-
17
-
18
-
19
-
20
-
21
-
22
-
23
-
24
-
25
-
26
-
27
-
28
-
29
-
30
-
31
-
32
-
33
-
34
-
35
-
36
-
37
-
38
-
39
-
40
-
41
-
42
-
43
-
44
-
45
-
46
-
47
-
48
-
49
-
50
-
51
-
52
-
53
-
54
-
55
-
56
-
57
-
58
-
59
-
60
-
61
-
62
-
63
-
64
-
65
-
66
-
67
-
68
-
69
-
70
-
71
-
72
-
73
-
74
-
75
-
76
-
77
-
78
-
79
-
80
-
81
-
82
-
83
-
84
-
85
-
86
-
 87
87 -
 88
88 -
 89
89 -
 90
90 -
 91
91 -
 92
92 -
 93
93 -
 94
94 -
 95
95 -
 96
96 -
 97
97 -
 98
98 -
 99
99 -
 100
100 -
 101
101 -
 102
102 -
 103
103 -
 104
104 -
 105
105 -
 106
106 -
 107
107 -
108
-
109
-
110
-
111
-
112
-
113
-
114
-
115
-
116
-
117
-
118
-
119
-
120
-
121
-
122
-
123
-
124
-
125
-
126
-
127
-
128
-
129
-
130
-
131
-
132
-
133
-
134
-
135
-
136
-
137
-
138
-
139
-
140
-
141
-
142
-
143
-
144
-
145
-
146
-
147
-
148
-
149
-
150
-
151
-
152
-
153
-
154
-
155
-
156
-
157
-
158
-
159
-
160
-
161
-
162
-
163
-
164
-
165
-
166
-
167
-
168
-
169
-
170
-
171
-
172
-
173
-
174
-
175
-
176
-
177
-
178
-
179
-
180
-
181
-
182
-
183
-
184
-
185
-
186
-
187
-
188
-
189
-
190
-
191
-
192
-
193
-
194
-
195
-
196
-
197
-
198
-
199
-
200
-
201
-
202
-
203
-
204
-
205
-
206
-
207
-
208
-
209
-
210
-
211
-
212
-
213
-
214
-
215
-
216
-
217
-
218
-
219
-
220
-
221
-
222
-
223
-
224
-
225
-
226
-
227
-
228
-
229
-
230
-
231
-
232
-
233
-
234
-
235
-
236
-
237
-
238
 |
 |

Table of Contents
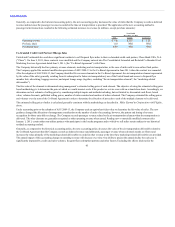
(e) Short-term investments are classified as available-for-sale and are stated at fair value. Realized gains and losses on sales of
investments are reflected in nonoperating income (expense) in the consolidated statements of operations. Unrealized gains and losses on available-for-sale
securities are reflected as a component of accumulated other comprehensive income/loss.
(f) The Company accounts for fuel and aircraft spare parts and supplies at average cost and provides an
obsolescence allowance for aircraft spare parts and supplies.
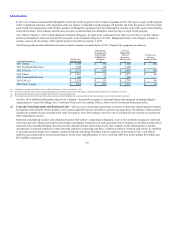
(g) The Company records additions to owned operating property and equipment at cost when acquired. Property under capital
leases and the related obligation for future lease payments are recorded at an amount equal to the initial present value of those lease payments.
Modifications that enhance the operating performance or extend the useful lives of airframes or engines are capitalized as property and equipment.
Depreciation and amortization of owned depreciable assets is based on the straight-line method over the assets’ estimated useful lives. Leasehold
improvements are amortized over the remaining term of the lease, including estimated facility renewal options when renewal is reasonably assured at key
airports, or the estimated useful life of the related asset, whichever is less. Properties under capital leases are amortized on the straight-line method over
the life of the lease or, in the case of certain aircraft, over their estimated useful lives, whichever is shorter. Amortization of capital lease assets is
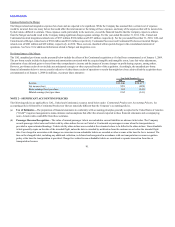
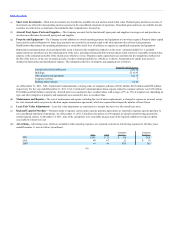
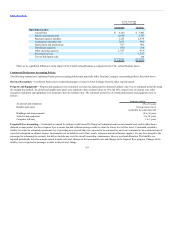
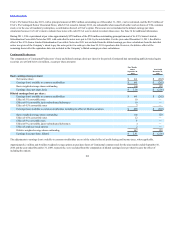
included in depreciation and amortization expense. The estimated useful lives of property and equipment are as follows:
Aircraft and related rotable parts 27 to 30
Buildings 25 to 45
Other property and equipment 4 to 15
Computer software 5
Building improvements 1 to 40
As of December 31, 2011, UAL, United and Continental had a carrying value of computer software of $361 million, $103 million and $258 million,
respectively. For the year ended December 31, 2011, UAL, United and Continental depreciation expense related to computer software was $133 million,
$91 million and $42 million, respectively. Aircraft parts were assumed to have residual values with a range of 7% to 11% of original cost, depending on
type, and other categories of property and equipment were assumed to have no residual value.
(h) The cost of maintenance and repairs, including the cost of minor replacements, is charged to expense as incurred, except
for costs incurred under our power-by-the-hour engine maintenance agreements, which are expensed based upon the number of hours flown.
(i) —Lease fair value adjustments are amortized on a straight line basis over the related lease term.
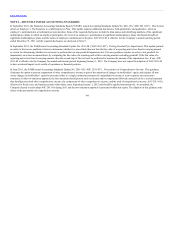
(j) Payments made to regional carriers under capacity purchase agreements are reported in regional capacity purchase in
our consolidated statement of operations. As of December 31, 2011, United has call options on 196 regional jet aircraft currently being operated by
certain regional carriers. At December 31, 2011, none of the call options were exercisable because none of the required conditions to make an option
exercisable by United were met.
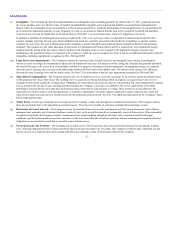
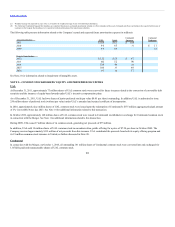
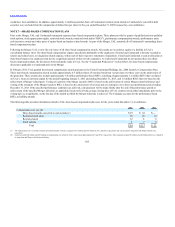
(k) Advertising costs, which are included in other operating expenses, are expensed as incurred. Advertising expenses for the three years
ended December 31 were as follows (in millions):
2011 $142 $73 $69 N/A
2010 90 67 23 $74
2009 44 44 N/A 102
96