United Airlines 2011 Annual Report Download - page 41
Download and view the complete annual report
Please find page 41 of the 2011 United Airlines annual report below. You can navigate through the pages in the report by either clicking on the pages listed below, or by using the keyword search tool below to find specific information within the annual report.-
 1
1 -
2
-
3
-
4
-
5
-
6
-
7
-
8
-
9
-
10
-
11
-
12
-
13
-
14
-
15
-
16
-
17
-
18
-
19
-
20
-
21
-
22
-
23
-
24
-
25
-
26
-
27
-
28
-
29
-
30
-
 31
31 -
 32
32 -
 33
33 -
 34
34 -
 35
35 -
 36
36 -
 37
37 -
 38
38 -
 39
39 -
 40
40 -
 41
41 -
 42
42 -
 43
43 -
 44
44 -
 45
45 -
 46
46 -
 47
47 -
 48
48 -
 49
49 -
 50
50 -
 51
51 -
52
-
53
-
54
-
55
-
56
-
57
-
58
-
59
-
60
-
61
-
62
-
63
-
64
-
65
-
66
-
67
-
68
-
69
-
70
-
71
-
72
-
73
-
74
-
75
-
76
-
77
-
78
-
79
-
80
-
81
-
82
-
83
-
84
-
85
-
86
-
87
-
88
-
89
-
90
-
91
-
92
-
93
-
94
-
95
-
96
-
97
-
98
-
99
-
100
-
101
-
102
-
103
-
104
-
105
-
106
-
107
-
108
-
109
-
110
-
111
-
112
-
113
-
114
-
115
-
116
-
117
-
118
-
119
-
120
-
121
-
122
-
123
-
124
-
125
-
126
-
127
-
128
-
129
-
130
-
131
-
132
-
133
-
134
-
135
-
136
-
137
-
138
-
139
-
140
-
141
-
142
-
143
-
144
-
145
-
146
-
147
-
148
-
149
-
150
-
151
-
152
-
153
-
154
-
155
-
156
-
157
-
158
-
159
-
160
-
161
-
162
-
163
-
164
-
165
-
166
-
167
-
168
-
169
-
170
-
171
-
172
-
173
-
174
-
175
-
176
-
177
-
178
-
179
-
180
-
181
-
182
-
183
-
184
-
185
-
186
-
187
-
188
-
189
-
190
-
191
-
192
-
193
-
194
-
195
-
196
-
197
-
198
-
199
-
200
-
201
-
202
-
203
-
204
-
205
-
206
-
207
-
208
-
209
-
210
-
211
-
212
-
213
-
214
-
215
-
216
-
217
-
218
-
219
-
220
-
221
-
222
-
223
-
224
-
225
-
226
-
227
-
228
-
229
-
230
-
231
-
232
-
233
-
234
-
235
-
236
-
237
-
238
 |
 |
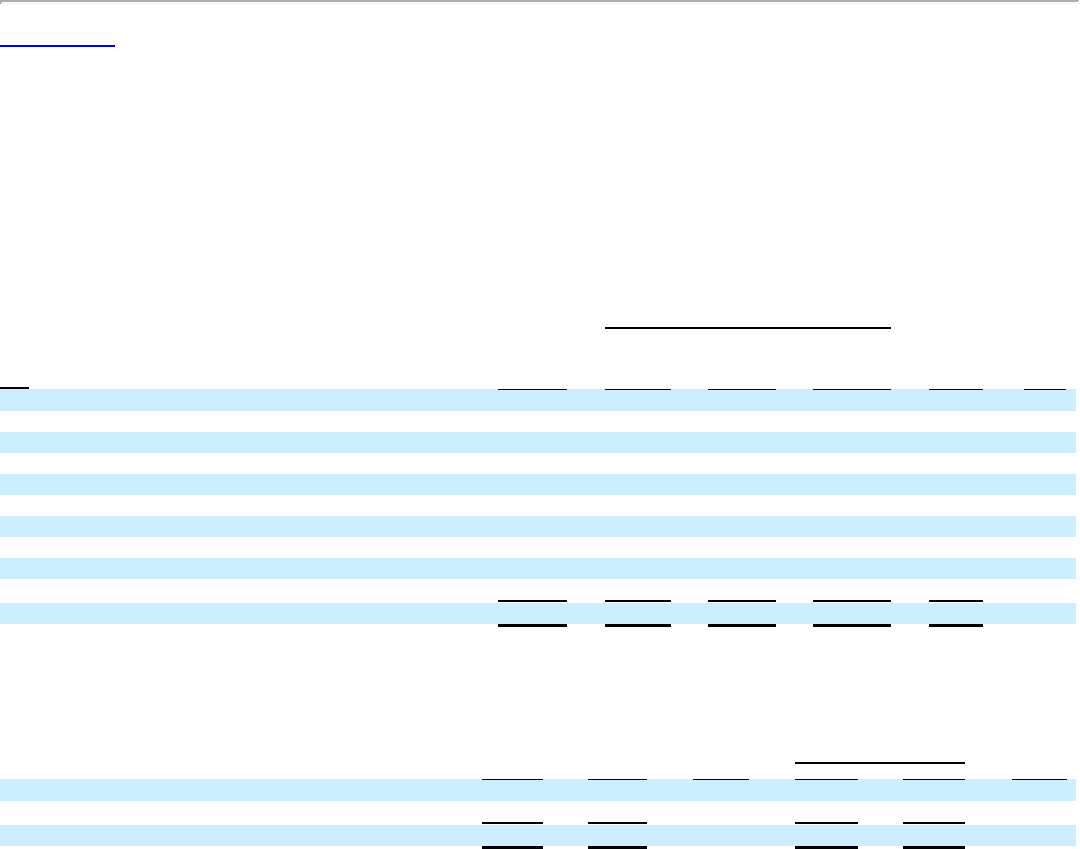
Table of Contents
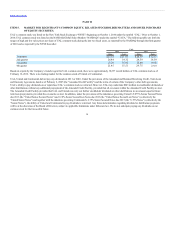
decline of 11.9%. Freight yields in 2011 increased 18% compared to 2010 due to higher fuel surcharges and processing fees. Mail yields decreased nearly 10%
in 2011 as compared to 2010 in all geographic regions except for Latin America.
On a combined basis, other operating revenue was up $111 million, or 3.5%, in 2011 as compared to 2010, which was primarily due to growth in ancillary
passenger-related charges.
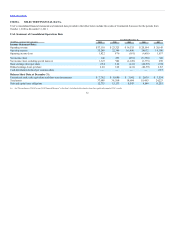
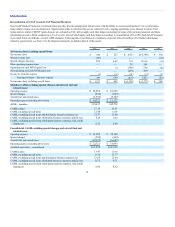
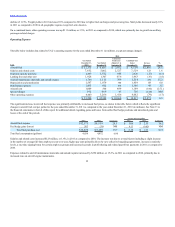
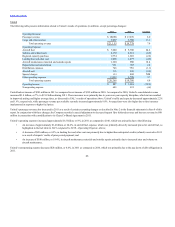
Operating Expense
The table below includes data related to UAL’s operating expense for the year ended December 31 (in millions, except percentage changes).
Aircraft fuel $12,375 $6,687 $2,872 $9,559 $2,816 29.5
Salaries and related costs 7,652 5,002 2,527 7,529 123 1.6
Regional capacity purchase 2,403 1,812 608 2,420 (17) (0.7)
Landing fees and other rent 1,928 1,307 656 1,963 (35) (1.8)
Aircraft maintenance materials and outside repairs 1,744 1,115 399 1,514 230 15.2
Depreciation and amortization 1,547 1,079 380 1,459 88 6.0
Distribution expenses 1,435 912 474 1,386 49 3.5
Aircraft rent 1,009 500 689 1,189 (180) (15.1)
Special charges 592 669 47 716 (124) NM
Other operating expenses 4,603 3,266 1,416 4,682 (79) (1.7)
$35,288 $ 22,349 $ 10,068 $32,417 $2,871 8.9
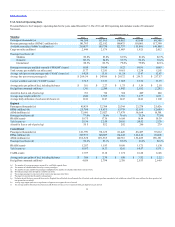
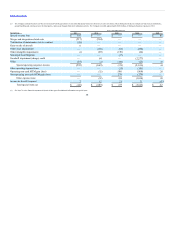
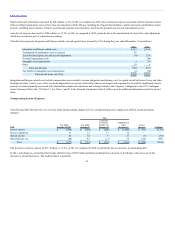
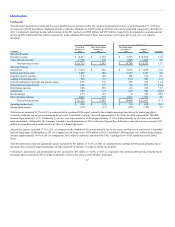
The significant increase in aircraft fuel expense was primarily attributable to increased fuel prices, as shown in the table below which reflects the significant
changes in aircraft fuel cost per gallon for the year ended December 31, 2011 as compared to the year ended December 31, 2010 (in millions). See Note 13 to
the financial statements in Item 8 of this report for additional details regarding gains and losses from settled fuel hedge positions and unrealized gains and
losses at the end of the periods.
Aircraft fuel expense $12,375 $9,559 29.5 $3.06 $ 2.35 30.2
Fuel hedge gains (losses) 503 (70) NM 0.13 (0.02) NM
Total fuel purchase cost $12,878 $9,489 35.7 $ 3.19 $2.33 36.9
Total fuel consumption (gallons) 4,038 4,072 (0.8)
Salaries and related costs increased $123 million, or 1.6%, in 2011 as compared to 2010. The increase was due to several factors including a slight increase
in the number of average full-time employees year-over-year, higher pay rates primarily driven by new collective bargaining agreements, increase in seniority
levels, a one-time signing bonus for certain employee groups and increased accruals in profit sharing and related payroll tax payments in 2011 as compared to
2010.
Expenses related to aircraft maintenance materials and outside repairs increased by $230 million, or 15.2%, in 2011 as compared to 2010, primarily due to
increased rates on aircraft engine maintenance.
40