United Airlines 2011 Annual Report Download - page 40
Download and view the complete annual report
Please find page 40 of the 2011 United Airlines annual report below. You can navigate through the pages in the report by either clicking on the pages listed below, or by using the keyword search tool below to find specific information within the annual report.-
 1
1 -
2
-
3
-
4
-
5
-
6
-
7
-
8
-
9
-
10
-
11
-
12
-
13
-
14
-
15
-
16
-
17
-
18
-
19
-
20
-
21
-
22
-
23
-
24
-
25
-
26
-
27
-
28
-
29
-
 30
30 -
 31
31 -
 32
32 -
 33
33 -
 34
34 -
 35
35 -
 36
36 -
 37
37 -
 38
38 -
 39
39 -
 40
40 -
 41
41 -
 42
42 -
 43
43 -
 44
44 -
 45
45 -
 46
46 -
 47
47 -
 48
48 -
 49
49 -
 50
50 -
51
-
52
-
53
-
54
-
55
-
56
-
57
-
58
-
59
-
60
-
61
-
62
-
63
-
64
-
65
-
66
-
67
-
68
-
69
-
70
-
71
-
72
-
73
-
74
-
75
-
76
-
77
-
78
-
79
-
80
-
81
-
82
-
83
-
84
-
85
-
86
-
87
-
88
-
89
-
90
-
91
-
92
-
93
-
94
-
95
-
96
-
97
-
98
-
99
-
100
-
101
-
102
-
103
-
104
-
105
-
106
-
107
-
108
-
109
-
110
-
111
-
112
-
113
-
114
-
115
-
116
-
117
-
118
-
119
-
120
-
121
-
122
-
123
-
124
-
125
-
126
-
127
-
128
-
129
-
130
-
131
-
132
-
133
-
134
-
135
-
136
-
137
-
138
-
139
-
140
-
141
-
142
-
143
-
144
-
145
-
146
-
147
-
148
-
149
-
150
-
151
-
152
-
153
-
154
-
155
-
156
-
157
-
158
-
159
-
160
-
161
-
162
-
163
-
164
-
165
-
166
-
167
-
168
-
169
-
170
-
171
-
172
-
173
-
174
-
175
-
176
-
177
-
178
-
179
-
180
-
181
-
182
-
183
-
184
-
185
-
186
-
187
-
188
-
189
-
190
-
191
-
192
-
193
-
194
-
195
-
196
-
197
-
198
-
199
-
200
-
201
-
202
-
203
-
204
-
205
-
206
-
207
-
208
-
209
-
210
-
211
-
212
-
213
-
214
-
215
-
216
-
217
-
218
-
219
-
220
-
221
-
222
-
223
-
224
-
225
-
226
-
227
-
228
-
229
-
230
-
231
-
232
-
233
-
234
-
235
-
236
-
237
-
238
 |
 |

Table of Contents
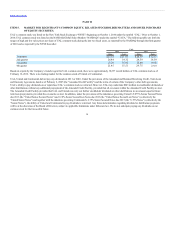
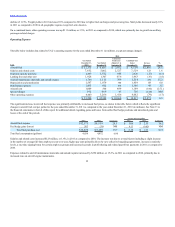
Operating Revenue
The table below illustrates the year-over-year percentage change in UAL’s operating revenues for the years ended December 31 (in millions, except percentage
changes):
Passenger—Mainline $25,975 $16,019 $7,777 $23,796 $2,179 9.2
Passenger—Regional 6,536 4,217 1,726 5,943 593 10.0
Total passenger revenue 32,511 20,236 9,503 29,739 2,772 9.3
Cargo 1,167 832 328 1,160 7 0.6
Special revenue item 107 — — — 107 NM
Other operating revenue 3,325 2,257 957 3,214 111 3.5
$37,110 $ 23,325 $ 10,788 $34,113 $2,997 8.8
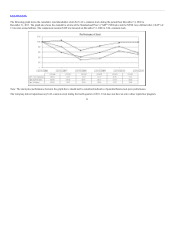
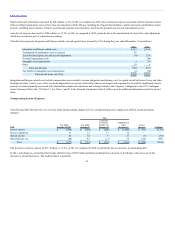
The table below presents UAL’s passenger revenues and operating data based on geographic region:
Passenger revenue (in millions) $949 $ 319 $407 $504 $2,179 $593 $2,772
Passenger revenue 7.9% 7.5% 7.6% 23.7% 9.2% 10.0% 9.3%
Average fare per passenger 12.5% 10.8% 8.7% 19.6% 12.7% 11.6% 12.2%
Yield 10.6% 9.3% 8.7% 19.5% 10.8% 10.8% 10.9%
PRASM 10.9% 6.4% 5.1% 17.6% 9.5% 9.8% 9.6%
Average stage length 1.9% 1.4% (1.0)% (0.5)% 8.5% 0.5% 1.7%
Passengers (4.1)% (3.0)% (1.0)% 3.5% (3.1)% (1.4)% (2.6)%
RPMs (traffic) (2.5)% (1.6)% (1.0)% 3.5% (1.5)% (0.7)% (1.4)%
ASMs (capacity) (2.8)% 1.0% 2.4% 5.3% (0.3)% 0.2% (0.2)%
Passenger load factor 0.2 pts. (2.2) pts. (2.7) pts. (1.3) pts. (1.1) pts. (0.7) pts. (1.0) pts.
(a) 2010 passenger revenue and operating data prepared from UAL results combined with Continental Predecessor results for the period in 2010 prior to the Merger.
On a combined basis, consolidated passenger revenue in 2011 increased approximately $2.8 billion, or 9.3%, as compared to 2010. These increases were due
to increases of 12.2% and 10.9% in average fare per passenger and yield, respectively, over the same period as a result of improved pricing primarily from
industry capacity discipline. The reduced traffic from both business and leisure passengers in 2011 was offset by higher fares, which drove improvements in
both average fare per passenger and yield. The average fare per passenger also increased in the 2011 period, as compared to the 2010 period, due to a number
of fare increases implemented in response to higher fuel prices.
Passenger revenue also increased in 2011 as a result of certain accounting changes, as described in Note 2 to the financial statements in Item 8 of this report. In
conjunction with these changes, the Company recorded a special adjustment in 2011 to decrease frequent flyer deferred revenue and increase revenue by $107
million in connection with a modification to its Co-Brand Agreement.
Cargo revenue increased by $7 million, or 0.6%, on a combined basis in 2011 as compared to 2010. Reduced cargo volume in 2011 was offset by higher
yields. UAL’s freight ton miles decreased 13.7% in 2011 as compared to 2010, while mail ton miles improved slightly by 2.2% during the same period, for a
composite cargo traffic
39