United Airlines 2011 Annual Report Download - page 46
Download and view the complete annual report
Please find page 46 of the 2011 United Airlines annual report below. You can navigate through the pages in the report by either clicking on the pages listed below, or by using the keyword search tool below to find specific information within the annual report.-
 1
1 -
2
-
3
-
4
-
5
-
6
-
7
-
8
-
9
-
10
-
11
-
12
-
13
-
14
-
15
-
16
-
17
-
18
-
19
-
20
-
21
-
22
-
23
-
24
-
25
-
26
-
27
-
28
-
29
-
30
-
31
-
32
-
33
-
34
-
35
-
 36
36 -
 37
37 -
 38
38 -
 39
39 -
 40
40 -
 41
41 -
 42
42 -
 43
43 -
 44
44 -
 45
45 -
 46
46 -
 47
47 -
 48
48 -
 49
49 -
 50
50 -
 51
51 -
 52
52 -
 53
53 -
 54
54 -
 55
55 -
 56
56 -
57
-
58
-
59
-
60
-
61
-
62
-
63
-
64
-
65
-
66
-
67
-
68
-
69
-
70
-
71
-
72
-
73
-
74
-
75
-
76
-
77
-
78
-
79
-
80
-
81
-
82
-
83
-
84
-
85
-
86
-
87
-
88
-
89
-
90
-
91
-
92
-
93
-
94
-
95
-
96
-
97
-
98
-
99
-
100
-
101
-
102
-
103
-
104
-
105
-
106
-
107
-
108
-
109
-
110
-
111
-
112
-
113
-
114
-
115
-
116
-
117
-
118
-
119
-
120
-
121
-
122
-
123
-
124
-
125
-
126
-
127
-
128
-
129
-
130
-
131
-
132
-
133
-
134
-
135
-
136
-
137
-
138
-
139
-
140
-
141
-
142
-
143
-
144
-
145
-
146
-
147
-
148
-
149
-
150
-
151
-
152
-
153
-
154
-
155
-
156
-
157
-
158
-
159
-
160
-
161
-
162
-
163
-
164
-
165
-
166
-
167
-
168
-
169
-
170
-
171
-
172
-
173
-
174
-
175
-
176
-
177
-
178
-
179
-
180
-
181
-
182
-
183
-
184
-
185
-
186
-
187
-
188
-
189
-
190
-
191
-
192
-
193
-
194
-
195
-
196
-
197
-
198
-
199
-
200
-
201
-
202
-
203
-
204
-
205
-
206
-
207
-
208
-
209
-
210
-
211
-
212
-
213
-
214
-
215
-
216
-
217
-
218
-
219
-
220
-
221
-
222
-
223
-
224
-
225
-
226
-
227
-
228
-
229
-
230
-
231
-
232
-
233
-
234
-
235
-
236
-
237
-
238
 |
 |

Table of Contents
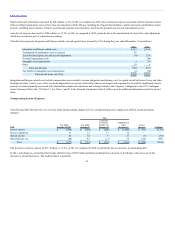
In 2009, UAL recorded a $150 million intangible asset impairment ($95 million, net of taxes) to decrease the value of United’s tradename, which was
primarily due to a decrease in estimated future revenues resulting from the weak economic environment and United’s capacity reductions, among other factors.
In 2009, UAL recorded special charges of $27 million related to the final settlement of the LAX municipal bond litigation and $104 million primarily related
to Boeing 737 aircraft lease terminations.
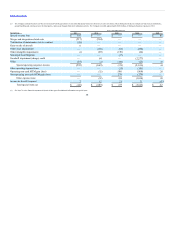
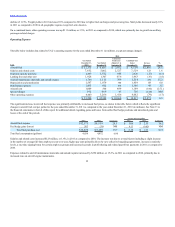
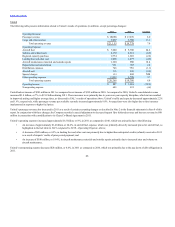
Nonoperating Income (Expense)
The following table illustrates the year-over-year dollar and percentage changes in UAL’s nonoperating income (expense) (in millions, except percentage
changes):
Interest expense $(798) $(577) $(221) $ (86) $(135) (23.4)
Interest capitalized 15 10 5 4 1 10.0
Interest income 15 19 (4) 3 (7) (36.8)
Miscellaneous, net 45 41 4 2 2 4.9
Total $(723) $(507) $(216) $(77) $(139) (27.4)
The increase in interest expense in 2010 as compared to 2009, excluding the Merger impact, was primarily due to higher interest rates on average debt
outstanding in 2010 as compared to comparable rates on average debt outstanding in 2009, as certain of the Company’s financings have terms with higher
interest rates as compared to debt that has been repaid. The higher interest rates were due to distressed capital markets and the Company’s credit and liquidity
outlook at the time of the financings.
In 2010, miscellaneous, net included a gain of $21 million from the distribution to United of the remaining United Series 2001-1 EETC assets upon
repayment of the note obligations. In addition, miscellaneous, net included $10 million of hedge ineffectiveness gains in 2010 on fuel hedge contracts that were
designated as cash flow hedges, as compared to $31 million of fuel hedge gains in 2009. The fuel hedge gains in 2009 resulted from hedge contracts that were
not designated as cash flow hedges
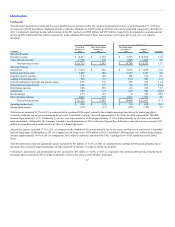
United and Continental—Results of Operations—2011 Compared to 2010
United and Continental’s have been abbreviated pursuant to
General Instructions I(2)(a) of Form 10-K.
45