United Airlines 2011 Annual Report Download - page 60
Download and view the complete annual report
Please find page 60 of the 2011 United Airlines annual report below. You can navigate through the pages in the report by either clicking on the pages listed below, or by using the keyword search tool below to find specific information within the annual report.-
 1
1 -
2
-
3
-
4
-
5
-
6
-
7
-
8
-
9
-
10
-
11
-
12
-
13
-
14
-
15
-
16
-
17
-
18
-
19
-
20
-
21
-
22
-
23
-
24
-
25
-
26
-
27
-
28
-
29
-
30
-
31
-
32
-
33
-
34
-
35
-
36
-
37
-
38
-
39
-
40
-
41
-
42
-
43
-
44
-
45
-
46
-
47
-
48
-
49
-
 50
50 -
 51
51 -
 52
52 -
 53
53 -
 54
54 -
 55
55 -
 56
56 -
 57
57 -
 58
58 -
 59
59 -
 60
60 -
 61
61 -
 62
62 -
 63
63 -
 64
64 -
 65
65 -
 66
66 -
 67
67 -
 68
68 -
 69
69 -
 70
70 -
71
-
72
-
73
-
74
-
75
-
76
-
77
-
78
-
79
-
80
-
81
-
82
-
83
-
84
-
85
-
86
-
87
-
88
-
89
-
90
-
91
-
92
-
93
-
94
-
95
-
96
-
97
-
98
-
99
-
100
-
101
-
102
-
103
-
104
-
105
-
106
-
107
-
108
-
109
-
110
-
111
-
112
-
113
-
114
-
115
-
116
-
117
-
118
-
119
-
120
-
121
-
122
-
123
-
124
-
125
-
126
-
127
-
128
-
129
-
130
-
131
-
132
-
133
-
134
-
135
-
136
-
137
-
138
-
139
-
140
-
141
-
142
-
143
-
144
-
145
-
146
-
147
-
148
-
149
-
150
-
151
-
152
-
153
-
154
-
155
-
156
-
157
-
158
-
159
-
160
-
161
-
162
-
163
-
164
-
165
-
166
-
167
-
168
-
169
-
170
-
171
-
172
-
173
-
174
-
175
-
176
-
177
-
178
-
179
-
180
-
181
-
182
-
183
-
184
-
185
-
186
-
187
-
188
-
189
-
190
-
191
-
192
-
193
-
194
-
195
-
196
-
197
-
198
-
199
-
200
-
201
-
202
-
203
-
204
-
205
-
206
-
207
-
208
-
209
-
210
-
211
-
212
-
213
-
214
-
215
-
216
-
217
-
218
-
219
-
220
-
221
-
222
-
223
-
224
-
225
-
226
-
227
-
228
-
229
-
230
-
231
-
232
-
233
-
234
-
235
-
236
-
237
-
238
 |
 |

Table of Contents
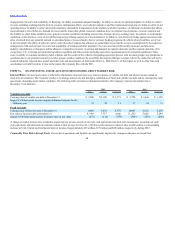
The following table summarizes information related to the Company’s frequent flyer deferred revenue:
Frequent flyer deferred revenue at December 31, 2011 (in millions) $5,658 $3,502 $2,156
% of miles earned expected to expire or go unredeemed 24% 24% 25%
Impact of 1% change in outstanding miles or weighted average ticket value on deferred revenue (in
millions) $74 $33 $41
In 2011, the Company announced that MileagePlus will be the loyalty program for the Company beginning in 2012. Moving to a single loyalty program will
be a significant milestone in the integration of the two airlines. Continental’s OnePass program will formally end in the first quarter of 2012 at which point
United will automatically enroll OnePass members in MileagePlus and deposit into those MileagePlus accounts award miles equal to their OnePass award
miles balance. The Company currently does not expect a material impact in redemptions from merging its two loyalty programs.
Asset Impairments. Goodwill and indefinite-lived intangible assets are not amortized but are reviewed for impairment annually, as of October 1, or more
frequently if events or circumstances indicate that the asset may be impaired. Long-lived assets are amortized over their estimated useful lives and are reviewed
for impairment whenever an indicator of impairment exists.
Goodwill as of December 31, 2011 represents the excess purchase price over the fair value of Continental’s assets acquired and liabilities assumed in the
Merger. All goodwill and other purchase accounting adjustments have been pushed down to Continental’s financial statements.
Goodwill is measured for impairment by initially comparing the fair value of the reporting unit to its carrying value, including goodwill. If the fair value of the
reporting unit is less than the carrying value, a second step is performed to determine the implied fair value of goodwill. If the implied fair value of goodwill is
lower than its carrying value, an impairment charge equal to the difference is recorded.
The Company has one consolidated reporting unit. In 2011, the Company estimated the fair value of the consolidated reporting unit using both an income and
a market approach. The income approach computes fair value by discounting future cash flows of the business and is dependent on a number of critical
management assumptions including estimates of future capacity, passenger yield, traffic, operating costs (including fuel prices), appropriate discount rates
and other relevant assumptions. The market approach computes fair value by adding a control premium to the Company’s market capitalization. The
Company’s fair value exceeded its carrying value under both approaches and no goodwill impairment was recorded in 2011.
The Company is also required to assess the goodwill recorded on the separate financial statements of Continental for impairment. The fair value of Continental
was determined by allocating a percentage of the fair value of the consolidated Company (as determined and described in the paragraph above). The percentage
of the consolidated fair value allocated to Continental was based on a number of measures, including revenue share, operating earnings share, available seat
mile share, revenue passenger mile share and passenger share. Based on these criteria, this resulted in a fair value allocation of such assets to Continental and
United of 44% and 56%, respectively. The fair value of Continental exceeded its carrying value and no goodwill impairment was recorded as of December 31,
2011.
The Company’s indefinite-lived intangible assets include certain international route authorities, take-off and landing slots at various airports, airline partner
alliances, the UAL trade name and logo. The fair values of the assets for purposes of the annual impairment test were determined using the market and income
approaches. The fair value measurements were primarily based on significant inputs that are not observable in the market. We utilized the market approach to
value certain intangible assets such as airport take-off and landing slots when sufficient market information was available. The income approach was
primarily used to value the international
59