United Airlines 2011 Annual Report Download - page 34
Download and view the complete annual report
Please find page 34 of the 2011 United Airlines annual report below. You can navigate through the pages in the report by either clicking on the pages listed below, or by using the keyword search tool below to find specific information within the annual report.-
 1
1 -
2
-
3
-
4
-
5
-
6
-
7
-
8
-
9
-
10
-
11
-
12
-
13
-
14
-
15
-
16
-
17
-
18
-
19
-
20
-
21
-
22
-
23
-
 24
24 -
 25
25 -
 26
26 -
 27
27 -
 28
28 -
 29
29 -
 30
30 -
 31
31 -
 32
32 -
 33
33 -
 34
34 -
 35
35 -
 36
36 -
 37
37 -
 38
38 -
 39
39 -
 40
40 -
 41
41 -
 42
42 -
 43
43 -
 44
44 -
45
-
46
-
47
-
48
-
49
-
50
-
51
-
52
-
53
-
54
-
55
-
56
-
57
-
58
-
59
-
60
-
61
-
62
-
63
-
64
-
65
-
66
-
67
-
68
-
69
-
70
-
71
-
72
-
73
-
74
-
75
-
76
-
77
-
78
-
79
-
80
-
81
-
82
-
83
-
84
-
85
-
86
-
87
-
88
-
89
-
90
-
91
-
92
-
93
-
94
-
95
-
96
-
97
-
98
-
99
-
100
-
101
-
102
-
103
-
104
-
105
-
106
-
107
-
108
-
109
-
110
-
111
-
112
-
113
-
114
-
115
-
116
-
117
-
118
-
119
-
120
-
121
-
122
-
123
-
124
-
125
-
126
-
127
-
128
-
129
-
130
-
131
-
132
-
133
-
134
-
135
-
136
-
137
-
138
-
139
-
140
-
141
-
142
-
143
-
144
-
145
-
146
-
147
-
148
-
149
-
150
-
151
-
152
-
153
-
154
-
155
-
156
-
157
-
158
-
159
-
160
-
161
-
162
-
163
-
164
-
165
-
166
-
167
-
168
-
169
-
170
-
171
-
172
-
173
-
174
-
175
-
176
-
177
-
178
-
179
-
180
-
181
-
182
-
183
-
184
-
185
-
186
-
187
-
188
-
189
-
190
-
191
-
192
-
193
-
194
-
195
-
196
-
197
-
198
-
199
-
200
-
201
-
202
-
203
-
204
-
205
-
206
-
207
-
208
-
209
-
210
-
211
-
212
-
213
-
214
-
215
-
216
-
217
-
218
-
219
-
220
-
221
-
222
-
223
-
224
-
225
-
226
-
227
-
228
-
229
-
230
-
231
-
232
-
233
-
234
-
235
-
236
-
237
-
238
 |
 |

Table of Contents
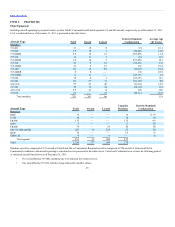
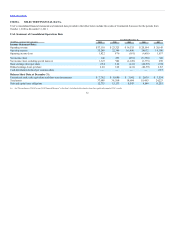
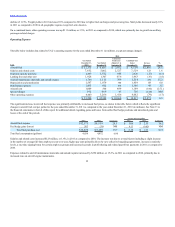
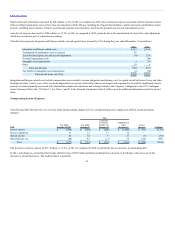
Presented below is the Company’s operating data for the years ended December 31. The 2011 and 2010 operating data includes results of Continental
Successor.
Passengers (thousands) (a) 96,360 65,365 56,082 63,149 68,386
Revenue passenger miles (“RPMs”) (millions) (b) 181,763 122,182 100,475 110,061 117,399
Available seat miles (“ASMs”) (millions) (c) 219,437 145,738 122,737 135,861 141,890
Cargo ton miles (millions) 2,646 2,176 1,603 1,921 2,012
Passenger load factor (d)
Mainline 82.8% 83.8% 81.9% 81.0% 82.7%
Domestic 85.1% 84.8% 83.7% 82.6% 83.2%
International 80.5% 82.7% 79.4% 79.0% 82.1%
Passenger revenue per available seat mile (“PRASM”) (cents) 11.84 10.99 9.22 10.91 10.49
Total revenue per available seat mile (cents) 13.77 12.91 10.81 12.58 12.03
Average yield per revenue passenger mile (“Yield”) (cents) (e) 14.29 13.11 11.26 13.47 12.67
Average fare per revenue passenger (f) $269.56 $ 245.06 $201.72 $234.71 $217.57
Cost per available seat mile (“CASM”) (cents) 13.15 12.51 11.05 15.74 11.39
Average price per gallon of fuel, including fuel taxes $3.01 $ 2.27 $1.75 $3.54 $ 2.18
Fuel gallons consumed (millions) 3,303 2,280 1,942 2,182 2,292
Aircraft in fleet at end of period (g) 701 710 360 409 460
Average stage length (miles) (h) 1,844 1,789 1,701 1,677 1,631
Average daily utilization of each aircraft (hours) (i) 10:42 10:47 10:47 10:42 11:00
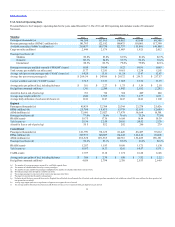
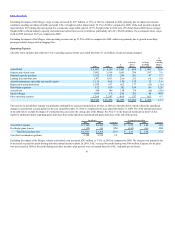
Passengers (thousands) (a) 45,439 32,764 25,344 23,278 25,426
RPMs (millions) (b) 25,768 18,675 13,770 12,155 12,649
ASMs (millions) (c) 33,091 23,827 17,979 16,164 16,301
Passenger load factor (d) 77.9% 78.4% 76.6% 75.2% 77.6%
PRASM (cents) 19.75 17.70 16.04 18.44 18.39
Yield (cents) (e) 25.36 22.58 20.95 24.52 23.70
Aircraft in fleet at end of period (g) 555 552 292 280 279
Passengers (thousands) (a) 141,799 98,129 81,426 86,427 93,812
RPMs (millions) (b) 207,531 140,857 114,245 122,216 130,048
ASMs (millions) (c) 252,528 169,565 140,716 152,025 158,191
Passenger load factor (d) 82.2% 83.1% 81.2% 80.4% 82.2%
PRASM (cents) 12.87 11.93 10.09 11.71 11.30
Yield (cents) (e) 15.67 14.37 12.43 14.57 13.71
CASM (cents) 13.97 13.18 11.72 16.20 12.08
Average price per gallon of fuel, including fuel taxes $3.06 $ 2.39 $1.80 $ 3.52 $ 2.22
Fuel gallons consumed (millions) 4,038 2,798 2,338 2,553 2,669
(a) The number of revenue passengers measured by each flight segment flown.
(b) The number of scheduled miles flown by revenue passengers.
(c) The number of seats available for passengers multiplied by the number of scheduled miles those seats are flown.
(d) Revenue passenger miles divided by available seat miles.
(e) The average passenger revenue received for each revenue passenger mile flown.
(f) Passenger revenue divided by number of passengers.
(g) Excludes aircraft that were removed from service. Regional aircraft include aircraft operated by all carriers under capacity purchase agreements, but exclude any aircraft that were subleased to other operators but
not operated on our behalf.
(h) Average stage length equals the average distance a flight travels weighted for size of aircraft.
(i) The average number of hours per day that an aircraft flown in revenue service is operated (from gate departure to gate arrival).
33