United Airlines 2011 Annual Report Download - page 42
Download and view the complete annual report
Please find page 42 of the 2011 United Airlines annual report below. You can navigate through the pages in the report by either clicking on the pages listed below, or by using the keyword search tool below to find specific information within the annual report.-
 1
1 -
2
-
3
-
4
-
5
-
6
-
7
-
8
-
9
-
10
-
11
-
12
-
13
-
14
-
15
-
16
-
17
-
18
-
19
-
20
-
21
-
22
-
23
-
24
-
25
-
26
-
27
-
28
-
29
-
30
-
31
-
 32
32 -
 33
33 -
 34
34 -
 35
35 -
 36
36 -
 37
37 -
 38
38 -
 39
39 -
 40
40 -
 41
41 -
 42
42 -
 43
43 -
 44
44 -
 45
45 -
 46
46 -
 47
47 -
 48
48 -
 49
49 -
 50
50 -
 51
51 -
 52
52 -
53
-
54
-
55
-
56
-
57
-
58
-
59
-
60
-
61
-
62
-
63
-
64
-
65
-
66
-
67
-
68
-
69
-
70
-
71
-
72
-
73
-
74
-
75
-
76
-
77
-
78
-
79
-
80
-
81
-
82
-
83
-
84
-
85
-
86
-
87
-
88
-
89
-
90
-
91
-
92
-
93
-
94
-
95
-
96
-
97
-
98
-
99
-
100
-
101
-
102
-
103
-
104
-
105
-
106
-
107
-
108
-
109
-
110
-
111
-
112
-
113
-
114
-
115
-
116
-
117
-
118
-
119
-
120
-
121
-
122
-
123
-
124
-
125
-
126
-
127
-
128
-
129
-
130
-
131
-
132
-
133
-
134
-
135
-
136
-
137
-
138
-
139
-
140
-
141
-
142
-
143
-
144
-
145
-
146
-
147
-
148
-
149
-
150
-
151
-
152
-
153
-
154
-
155
-
156
-
157
-
158
-
159
-
160
-
161
-
162
-
163
-
164
-
165
-
166
-
167
-
168
-
169
-
170
-
171
-
172
-
173
-
174
-
175
-
176
-
177
-
178
-
179
-
180
-
181
-
182
-
183
-
184
-
185
-
186
-
187
-
188
-
189
-
190
-
191
-
192
-
193
-
194
-
195
-
196
-
197
-
198
-
199
-
200
-
201
-
202
-
203
-
204
-
205
-
206
-
207
-
208
-
209
-
210
-
211
-
212
-
213
-
214
-
215
-
216
-
217
-
218
-
219
-
220
-
221
-
222
-
223
-
224
-
225
-
226
-
227
-
228
-
229
-
230
-
231
-
232
-
233
-
234
-
235
-
236
-
237
-
238
 |
 |
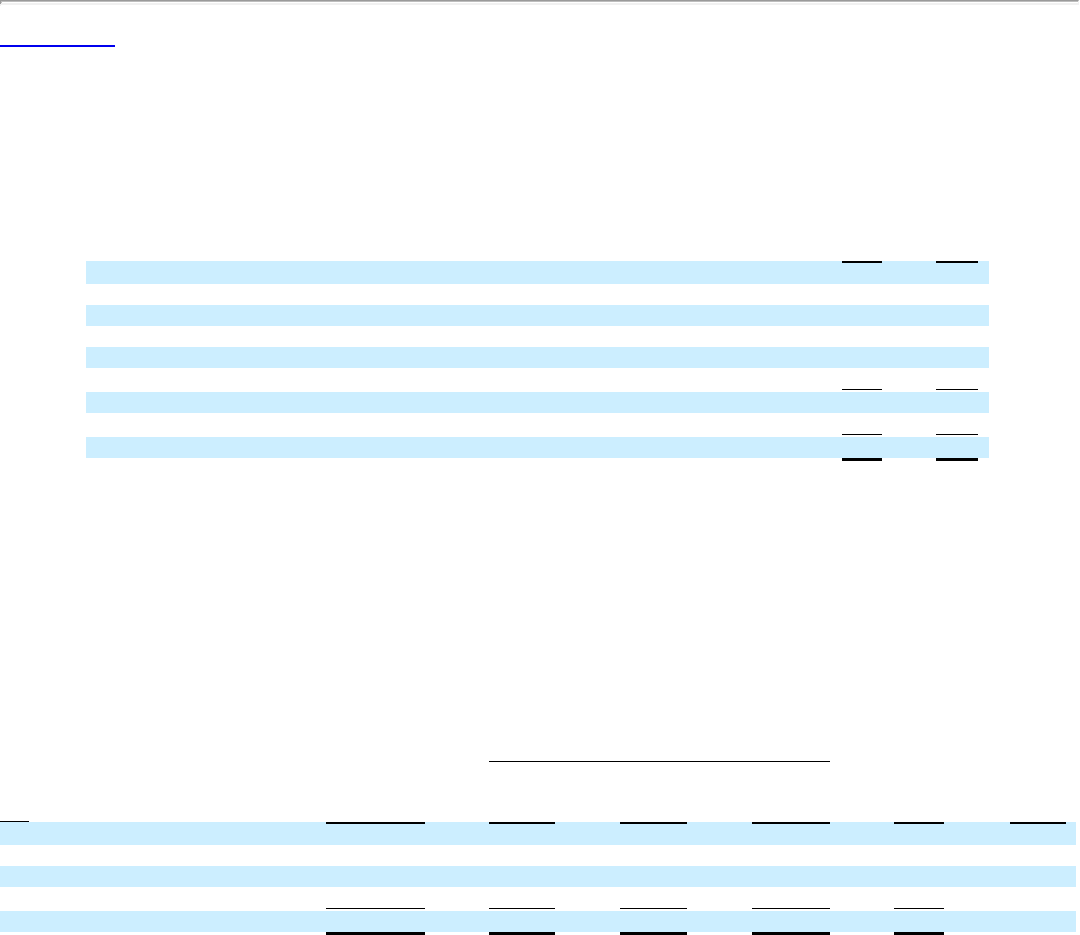
Table of Contents
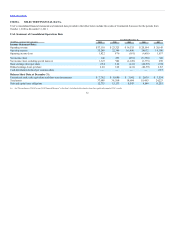
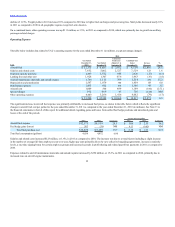
Depreciation and amortization increased by $88 million, or 6%, in 2011 as compared to 2010, due to increased expense associated with the increase in basis
from recording Continental’s assets at fair value in connection with the Merger, including the frequent flyer database, and the increased capitalization of new
projects, including those related to United’s international premium travel products, which are the products used on our international service.
Aircraft rent expense decreased by $180 million, or 15.1%, in 2011 as compared to 2010, primarily due to the amortization of a lease fair value adjustment
which was recorded as part of acquisition accounting.
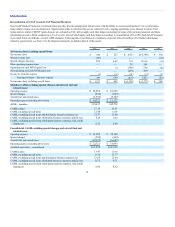
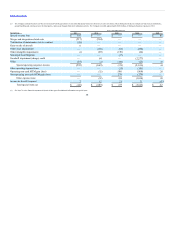
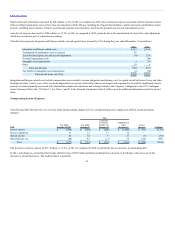
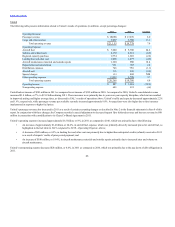
The table below presents integration and Merger-related costs and special items incurred by UAL during the years ended December 31 (in millions):
Integration and Merger-related costs $517 $564
Termination of maintenance service contract 58 —
Aircraft-related (gain), net and aircraft impairment (6) 136
Goodwill impairment credit — (64)
Intangible asset impairments 4 29
Other 19 4
Total special items 592 669
Tax benefit on intangible asset impairments (2) (12)
Total special items, net of tax $590 $657
Integration and Merger-related costs include compensation costs related to systems integration and training, costs to repaint aircraft in the new livery and other
branding activities, costs to write-off or accelerate depreciation on systems and facilities that are no longer used or planned to be used for significantly shorter
periods, severance primarily associated with administrative headcount reductions and a charge related to the Company’s obligation to issue 8% Contingent
Senior Unsecured Notes (the “8% Notes”). See Notes 1 and 21 to the financial statements in Item 8 of this report for additional information related to special
items.
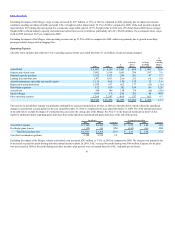
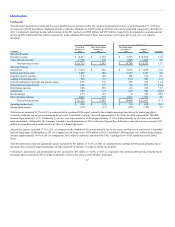
Nonoperating Income (Expense)
The following table illustrates the year-over-year dollar and percentage changes in UAL’s nonoperating income (expense) (in millions except percentage
changes):
Interest expense $ (949) $ (798) $(288) $ (1,086) $(137) (12.6)
Interest capitalized 32 15 17 32 — —
Interest income 20 15 6 21 (1) (4.8)
Miscellaneous, net (80) 45 (13) 32 (112) NM
Total $ (977) $(723) $(278) $(1,001) $(250) (25.0)
The decrease in interest expense of $137 million, or 12.6%, in 2011 as compared to 2010 was primarily due to a decrease in outstanding debt.
In 2011, miscellaneous, net included fuel hedge ineffectiveness of $59 million primarily resulting from a decrease in fuel hedge values in excess of the
decrease in aircraft fuel prices. The ineffectiveness is primarily
41