United Airlines 2011 Annual Report Download - page 7
Download and view the complete annual report
Please find page 7 of the 2011 United Airlines annual report below. You can navigate through the pages in the report by either clicking on the pages listed below, or by using the keyword search tool below to find specific information within the annual report.-
 1
1 -
 2
2 -
 3
3 -
 4
4 -
 5
5 -
 6
6 -
 7
7 -
 8
8 -
 9
9 -
 10
10 -
 11
11 -
 12
12 -
 13
13 -
 14
14 -
 15
15 -
 16
16 -
 17
17 -
 18
18 -
19
-
20
-
21
-
22
-
23
-
24
-
25
-
26
-
27
-
28
-
29
-
30
-
31
-
32
-
33
-
34
-
35
-
36
-
37
-
38
-
39
-
40
-
41
-
42
-
43
-
44
-
45
-
46
-
47
-
48
-
49
-
50
-
51
-
52
-
53
-
54
-
55
-
56
-
57
-
58
-
59
-
60
-
61
-
62
-
63
-
64
-
65
-
66
-
67
-
68
-
69
-
70
-
71
-
72
-
73
-
74
-
75
-
76
-
77
-
78
-
79
-
80
-
81
-
82
-
83
-
84
-
85
-
86
-
87
-
88
-
89
-
90
-
91
-
92
-
93
-
94
-
95
-
96
-
97
-
98
-
99
-
100
-
101
-
102
-
103
-
104
-
105
-
106
-
107
-
108
-
109
-
110
-
111
-
112
-
113
-
114
-
115
-
116
-
117
-
118
-
119
-
120
-
121
-
122
-
123
-
124
-
125
-
126
-
127
-
128
-
129
-
130
-
131
-
132
-
133
-
134
-
135
-
136
-
137
-
138
-
139
-
140
-
141
-
142
-
143
-
144
-
145
-
146
-
147
-
148
-
149
-
150
-
151
-
152
-
153
-
154
-
155
-
156
-
157
-
158
-
159
-
160
-
161
-
162
-
163
-
164
-
165
-
166
-
167
-
168
-
169
-
170
-
171
-
172
-
173
-
174
-
175
-
176
-
177
-
178
-
179
-
180
-
181
-
182
-
183
-
184
-
185
-
186
-
187
-
188
-
189
-
190
-
191
-
192
-
193
-
194
-
195
-
196
-
197
-
198
-
199
-
200
-
201
-
202
-
203
-
204
-
205
-
206
-
207
-
208
-
209
-
210
-
211
-
212
-
213
-
214
-
215
-
216
-
217
-
218
-
219
-
220
-
221
-
222
-
223
-
224
-
225
-
226
-
227
-
228
-
229
-
230
-
231
-
232
-
233
-
234
-
235
-
236
-
237
-
238
 |
 |

Table of Contents
Asiana Airlines, Austrian Airlines, Blue1, bmi, Brussels Airlines, Croatia Airlines, EGYPTAIR, Ethiopian Airlines, LOT Polish Airlines, Lufthansa,
Scandinavian Airlines, Singapore Airlines, South African Airways, Swiss International Air Lines, TAM, TAP Portugal, THAI, Turkish Airlines and US
Airways. Shenzhen Airlines, Avianca, TACA (“TACA”) and Copa Airlines (“Copa”) have been announced as future Star Alliance members.
In 2010, United, Continental and Air Canada entered into a memorandum of understanding to establish a revenue sharing trans-border joint venture. A joint
venture agreement was subsequently drafted based on the trans-Atlantic joint venture agreement among United, Continental, Air Canada and Lufthansa. While
the parties already have U.S. antitrust immunity, the Canadian Competition Bureau objected to the joint venture in June 2011 and the parties are currently
involved in litigation before the Canadian Competition Tribunal which may affect the implementation or the scope of the joint venture.
In 2010, pursuant to antitrust immunity approval granted by the DOT, United, Continental, Air Canada and Lufthansa entered into a joint venture agreement
as full participants covering trans-Atlantic routes. Between March 2011 and July 2011, Austrian Airlines, bmi and Swiss International Air Lines began
participation in the joint venture as part of the Lufthansa Group. In November 2011, the DOT confirmed Brussels Airlines is covered as a Lufthansa Group
affiliate within the existing antitrust-immunized alliance. Brussels Airlines is expected to be integrated into the trans-Atlantic joint venture during 2012 as a part
of the Lufthansa Group. Lufthansa recently announced an agreement to sell bmi, and upon conclusion of that sale, bmi will no longer participate in the joint
venture. The European Commission, which has been conducting a standard review of the competitive effects of the joint venture, has not yet completed its
review. The joint venture, which enables the carriers to integrate the services they operate between the United States and Europe and to capture revenue
synergies, delivers highly competitive flight schedules, fares and service. The joint venture has a revenue-sharing structure that results in payments among
full participants based on a formula that compares current period unit revenue performance on trans-Atlantic routes to a historic period, or “baseline,” which
is reset annually. The payments are calculated on a quarterly basis and subject to a cap. See below.
In November 2010, United, Continental and All Nippon Airways received antitrust immunity approval from the Japanese government and the DOT, enabling
the carriers to establish a trans-Pacific joint venture to integrate the services they operate between the United States and Japan, and other destinations in Asia,
and to derive potentially significant benefits from coordinated scheduling, pricing, sales and inventory management. The integration of services will also allow
the carriers to offer passengers highly competitive flight schedules, fares and services. We expect to fully implement the joint venture in 2012.
During 2011, United and Continental maintained independent marketing agreements with other air carriers including Aeromar, Aer Lingus, Avianca, Cape
Air, Colgan, Copa, Emirates, EVA Air, Great Lakes Airlines, Gulfstream, Hawaiian Airlines, Island Air, Jet Airways, Qatar Airways, SkyWest, TACA,
Trans States and Virgin Atlantic Airways. In addition, Continental offers a train-to-plane alliance with Amtrak from Newark Liberty to select regional
destinations.
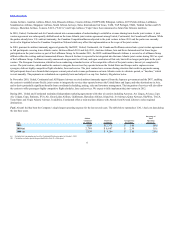
Fuel. Aircraft fuel has been the Company’s single largest operating expense for the last several years. The table below summarizes UAL’s fuel cost data during
the last three years.
4,038 $12,375 $3.06 36%
2,798 $6,687 $ 2.39 31%
2,338 $4,204 $1.80 26%
(a) Excludes fuel consumption and cost for Continental Predecessor prior to October 1, 2010.
(b) Calculation excludes special charges identified in Note 21 of this report.
6