United Airlines 2011 Annual Report Download - page 110
Download and view the complete annual report
Please find page 110 of the 2011 United Airlines annual report below. You can navigate through the pages in the report by either clicking on the pages listed below, or by using the keyword search tool below to find specific information within the annual report.-
 1
1 -
2
-
3
-
4
-
5
-
6
-
7
-
8
-
9
-
10
-
11
-
12
-
13
-
14
-
15
-
16
-
17
-
18
-
19
-
20
-
21
-
22
-
23
-
24
-
25
-
26
-
27
-
28
-
29
-
30
-
31
-
32
-
33
-
34
-
35
-
36
-
37
-
38
-
39
-
40
-
41
-
42
-
43
-
44
-
45
-
46
-
47
-
48
-
49
-
50
-
51
-
52
-
53
-
54
-
55
-
56
-
57
-
58
-
59
-
60
-
61
-
62
-
63
-
64
-
65
-
66
-
67
-
68
-
69
-
70
-
71
-
72
-
73
-
74
-
75
-
76
-
77
-
78
-
79
-
80
-
81
-
82
-
83
-
84
-
85
-
86
-
87
-
88
-
89
-
90
-
91
-
92
-
93
-
94
-
95
-
96
-
97
-
98
-
99
-
 100
100 -
 101
101 -
 102
102 -
 103
103 -
 104
104 -
 105
105 -
 106
106 -
 107
107 -
 108
108 -
 109
109 -
 110
110 -
 111
111 -
 112
112 -
 113
113 -
 114
114 -
 115
115 -
 116
116 -
 117
117 -
 118
118 -
 119
119 -
 120
120 -
121
-
122
-
123
-
124
-
125
-
126
-
127
-
128
-
129
-
130
-
131
-
132
-
133
-
134
-
135
-
136
-
137
-
138
-
139
-
140
-
141
-
142
-
143
-
144
-
145
-
146
-
147
-
148
-
149
-
150
-
151
-
152
-
153
-
154
-
155
-
156
-
157
-
158
-
159
-
160
-
161
-
162
-
163
-
164
-
165
-
166
-
167
-
168
-
169
-
170
-
171
-
172
-
173
-
174
-
175
-
176
-
177
-
178
-
179
-
180
-
181
-
182
-
183
-
184
-
185
-
186
-
187
-
188
-
189
-
190
-
191
-
192
-
193
-
194
-
195
-
196
-
197
-
198
-
199
-
200
-
201
-
202
-
203
-
204
-
205
-
206
-
207
-
208
-
209
-
210
-
211
-
212
-
213
-
214
-
215
-
216
-
217
-
218
-
219
-
220
-
221
-
222
-
223
-
224
-
225
-
226
-
227
-
228
-
229
-
230
-
231
-
232
-
233
-
234
-
235
-
236
-
237
-
238
 |
 |

Table of Contents
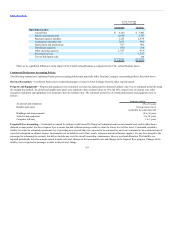
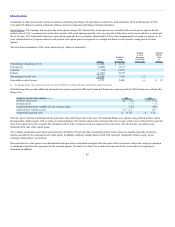
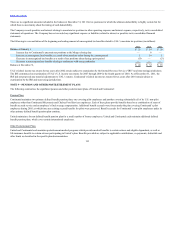
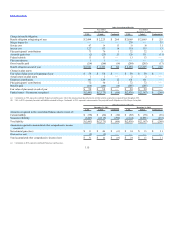
The following table provides additional information for options granted by Continental Predecessor in each period.
Risk-free interest rate 1.4% 2.0%
Dividend yield — % — %
Expected market price volatility of Continental common stock 88% 86%
Expected life of options (years) 3.8 3.9
Weighted average fair value $14.55 $5.75
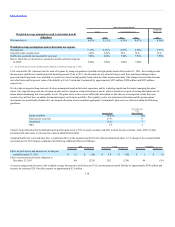
The Black-Scholes-Merton option-pricing model was used to value the options at the grant date. The risk-free interest rate was based on the U.S. Treasury
yield curve in effect for the expected term of the option at the time of grant. The dividend yield on Continental common stock was assumed to be zero since
Continental historically had not paid dividends. The market price volatility of Continental common stock was based on the historical volatility of the common
stock over a time period equal to the expected term of the option and ending on the grant date. The expected life of the options was based on Continental’s
historical experience for various work groups. Expense was recognized only for those option awards expected to vest, using an estimated forfeiture rate based
on historical experience.
Profit Based RSU Awards. See , above, for a discussion of the impact of the Merger on
PBRSU awards. Continental issued PBRSU awards pursuant to its long-term incentive and RSU programs, which provided for cash payments to
Continental’s officers upon the achievement of specified profit sharing-based performance targets. The performance targets required that Continental reach
target levels of cumulative employee profit sharing during the performance period and that Continental had net income calculated in accordance with U.S.
generally accepted accounting principles for the applicable fiscal year in which the cumulative profit sharing target was met. To serve as a retention feature,
payments related to the achievement of a performance target generally were made in annual increments over a three-year period to participants who remain
continuously employed by Continental through each payment date. Payments also were conditioned on Continental having, at the end of the fiscal year
preceding the date any payment was made, a minimum unrestricted cash, cash equivalents and short-term investments balance as set by the Human
Resources Committee of Continental’s Board of Directors. If Continental did not achieve the minimum cash balance applicable to a payment date, the payment
was deferred until the next payment date (March 1 of the next year), subject to a limit on the number of years payments could be carried forward. Payment
amounts were calculated based on the number of PBRSUs subject to the award, the average closing price of Continental common stock during the 20 trading
days preceding the payment date and the payment percentage set by the Human Resources Committee of Continental’s Board of Directors for achieving the
applicable profit sharing-based performance target.
Continental accounted for the PBRSU awards as liability awards. Once it became probable that a profit sharing-based performance target would be met,
Continental measured the awards at fair value based on its current stock price. The related expense was recognized ratably over the required service period,
which ended on each payment date, after adjustment for changes in the then-current market price of Continental’s common stock.
109