United Airlines 2011 Annual Report Download - page 95
Download and view the complete annual report
Please find page 95 of the 2011 United Airlines annual report below. You can navigate through the pages in the report by either clicking on the pages listed below, or by using the keyword search tool below to find specific information within the annual report.-
 1
1 -
2
-
3
-
4
-
5
-
6
-
7
-
8
-
9
-
10
-
11
-
12
-
13
-
14
-
15
-
16
-
17
-
18
-
19
-
20
-
21
-
22
-
23
-
24
-
25
-
26
-
27
-
28
-
29
-
30
-
31
-
32
-
33
-
34
-
35
-
36
-
37
-
38
-
39
-
40
-
41
-
42
-
43
-
44
-
45
-
46
-
47
-
48
-
49
-
50
-
51
-
52
-
53
-
54
-
55
-
56
-
57
-
58
-
59
-
60
-
61
-
62
-
63
-
64
-
65
-
66
-
67
-
68
-
69
-
70
-
71
-
72
-
73
-
74
-
75
-
76
-
77
-
78
-
79
-
80
-
81
-
82
-
83
-
84
-
 85
85 -
 86
86 -
 87
87 -
 88
88 -
 89
89 -
 90
90 -
 91
91 -
 92
92 -
 93
93 -
 94
94 -
 95
95 -
 96
96 -
 97
97 -
 98
98 -
 99
99 -
 100
100 -
 101
101 -
 102
102 -
 103
103 -
 104
104 -
 105
105 -
106
-
107
-
108
-
109
-
110
-
111
-
112
-
113
-
114
-
115
-
116
-
117
-
118
-
119
-
120
-
121
-
122
-
123
-
124
-
125
-
126
-
127
-
128
-
129
-
130
-
131
-
132
-
133
-
134
-
135
-
136
-
137
-
138
-
139
-
140
-
141
-
142
-
143
-
144
-
145
-
146
-
147
-
148
-
149
-
150
-
151
-
152
-
153
-
154
-
155
-
156
-
157
-
158
-
159
-
160
-
161
-
162
-
163
-
164
-
165
-
166
-
167
-
168
-
169
-
170
-
171
-
172
-
173
-
174
-
175
-
176
-
177
-
178
-
179
-
180
-
181
-
182
-
183
-
184
-
185
-
186
-
187
-
188
-
189
-
190
-
191
-
192
-
193
-
194
-
195
-
196
-
197
-
198
-
199
-
200
-
201
-
202
-
203
-
204
-
205
-
206
-
207
-
208
-
209
-
210
-
211
-
212
-
213
-
214
-
215
-
216
-
217
-
218
-
219
-
220
-
221
-
222
-
223
-
224
-
225
-
226
-
227
-
228
-
229
-
230
-
231
-
232
-
233
-
234
-
235
-
236
-
237
-
238
 |
 |

Table of Contents
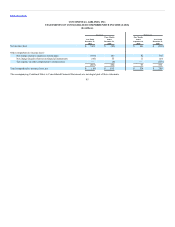
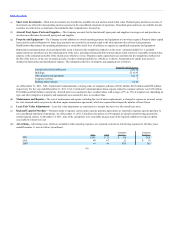
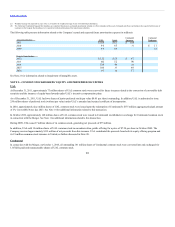
“Special Revenue Item” section below, the impact of adoption of ASU 2009-13 resulted in the following estimated increases to revenue (in millions,
except per share amounts):
Operating revenue $ 260 $180 $80
Per basic share 0.79 NM NM
Per diluted share 0.68 NM NM
Given the impact from the adoption of ASU 2009-13 on total revenue, there was a total impact on the Company’s profit sharing of approximately $90
million.
The transition provisions of ASU 2009-13 require that the Company’s existing deferred revenue balance be adjusted retroactively to reflect the value of
any undelivered element remaining at the date of contract modification as if we had been applying ASU 2009-13 since the initiation of the Co-Brand
Agreement. We applied this transition provision by revaluing the undelivered air transportation element using its new estimated selling price as
determined in connection with the contract modification. This estimated selling price was lower than the rate at which the undelivered element had been
deferred under the previous contracts and, as a result, we recorded the following one-time non-cash adjustment to decrease frequent flyer deferred revenue
and increase special revenue (in millions, except per share amounts):
Special revenue item $107 $ 88 $19
Per basic share 0.33 NM NM
Per diluted share 0.28 NM NM
United accounts for miles sold and awarded that will never be redeemed by program members, which we referred to as “breakage,” using the redemption
method. UAL reviews its breakage estimates annually based upon the latest available information regarding redemption and expiration patterns. During
the first quarter of 2010, United obtained additional historical data, previously unavailable, which enabled it to refine its estimate of the amount of
breakage in its population of miles, increasing the estimate of miles in the population expected to expire. Both the change in estimate and methodology
have been applied prospectively effective January 1, 2010. UAL and United estimate these changes increased passenger revenue by approximately $250
million, or $1.21 per UAL basic share ($0.99 per UAL diluted share), in the year ended December 31, 2010.
The Company’s estimate of the expected expiration of miles requires significant management judgment. Current and future changes to expiration
assumptions or to the expiration policy, or to program rules and program redemption opportunities, may result in material changes to the deferred
revenue balance as well as recognized revenues from the programs.
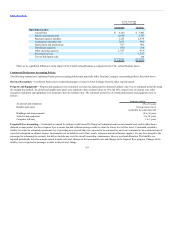
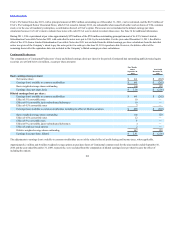
The following table summarizes information related to the Company’s frequent flyer deferred revenue (in millions, except rates):
Frequent flyer deferred revenue at December 31, 2011 $5,658 $3,502 $2,156
% of miles earned expected to expire or go unredeemed 24% 24% 25%
Impact of 1% change in outstanding miles or estimated selling price on deferred
revenue $74 $33 $41
94