United Airlines 2011 Annual Report Download - page 83
Download and view the complete annual report
Please find page 83 of the 2011 United Airlines annual report below. You can navigate through the pages in the report by either clicking on the pages listed below, or by using the keyword search tool below to find specific information within the annual report.-
 1
1 -
2
-
3
-
4
-
5
-
6
-
7
-
8
-
9
-
10
-
11
-
12
-
13
-
14
-
15
-
16
-
17
-
18
-
19
-
20
-
21
-
22
-
23
-
24
-
25
-
26
-
27
-
28
-
29
-
30
-
31
-
32
-
33
-
34
-
35
-
36
-
37
-
38
-
39
-
40
-
41
-
42
-
43
-
44
-
45
-
46
-
47
-
48
-
49
-
50
-
51
-
52
-
53
-
54
-
55
-
56
-
57
-
58
-
59
-
60
-
61
-
62
-
63
-
64
-
65
-
66
-
67
-
68
-
69
-
70
-
71
-
72
-
 73
73 -
 74
74 -
 75
75 -
 76
76 -
 77
77 -
 78
78 -
 79
79 -
 80
80 -
 81
81 -
 82
82 -
 83
83 -
 84
84 -
 85
85 -
 86
86 -
 87
87 -
 88
88 -
 89
89 -
 90
90 -
 91
91 -
 92
92 -
 93
93 -
94
-
95
-
96
-
97
-
98
-
99
-
100
-
101
-
102
-
103
-
104
-
105
-
106
-
107
-
108
-
109
-
110
-
111
-
112
-
113
-
114
-
115
-
116
-
117
-
118
-
119
-
120
-
121
-
122
-
123
-
124
-
125
-
126
-
127
-
128
-
129
-
130
-
131
-
132
-
133
-
134
-
135
-
136
-
137
-
138
-
139
-
140
-
141
-
142
-
143
-
144
-
145
-
146
-
147
-
148
-
149
-
150
-
151
-
152
-
153
-
154
-
155
-
156
-
157
-
158
-
159
-
160
-
161
-
162
-
163
-
164
-
165
-
166
-
167
-
168
-
169
-
170
-
171
-
172
-
173
-
174
-
175
-
176
-
177
-
178
-
179
-
180
-
181
-
182
-
183
-
184
-
185
-
186
-
187
-
188
-
189
-
190
-
191
-
192
-
193
-
194
-
195
-
196
-
197
-
198
-
199
-
200
-
201
-
202
-
203
-
204
-
205
-
206
-
207
-
208
-
209
-
210
-
211
-
212
-
213
-
214
-
215
-
216
-
217
-
218
-
219
-
220
-
221
-
222
-
223
-
224
-
225
-
226
-
227
-
228
-
229
-
230
-
231
-
232
-
233
-
234
-
235
-
236
-
237
-
238
 |
 |

Table of Contents
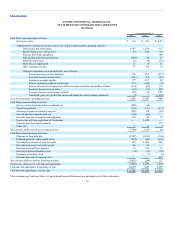
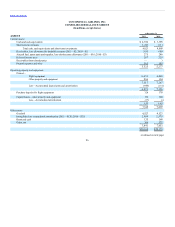
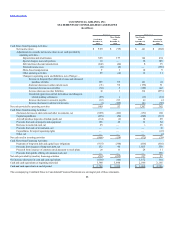
Cash Flows from Operating Activities:
Net income (loss) $ 281 $399 $ (628)
Adjustments to reconcile net income (loss) to net cash provided (used) by operating activities—
Depreciation and amortization 921 903 917
Special charges, non-cash portion 36 166 374
Proceeds from lease amendment — — 160
Debt and lease discount amortization 56 93 97
Deferred income taxes — (12) (16)
Share-based compensation 9 13 21
Other operating activities 77 83 48
Changes in operating assets and liabilities—
Increase (decrease) in frequent flyer deferred revenue and advanced purchase of miles (235) (126) 123
Increase in accounts payable 241 221 94
Increase (decrease) in other liabilities 200 262 (213)
Increase (decrease) in advance ticket sales 116 44 (38)
Increase in other current assets (129) (103) (19)
(Increase) decrease in receivables (123) (160) 110
(Increase) decrease in fuel hedge collateral (59) 10 955
Unrealized (gain) loss on fuel derivatives and change in related pending settlements 27 4 (1,007)
Net cash provided by operating activities 1,418 1,797 978
Cash Flows from Investing Activities:
Capital expenditures (464) (318) (317)
(Increase) decrease in short-term and other investments, net (269) 18 —
(Increase) decrease in restricted cash, net (210) 68 (24)
Proceeds from sale of property and equipment 15 40 77
Aircraft purchase deposits paid, net (6) (42) —
Proceeds from asset sale-leasebacks — — 175
Other, net 2 7 3
Net cash used in investing activities (932) (227) (86)
Cash Flows from Financing Activities:
Payments of long-term debt (1,456) (1,667) (793)
Principal payments under capital leases (246) (482) (190)
Decrease in aircraft lease deposits 15 236 23
Increase in deferred financing costs (8) (33) (49)
Proceeds from exercise of stock options 2 9 —
Proceeds from issuance of long-term debt — 1,995 562
Capital contribution from parent — — 559
Other, net — 1 (1)
Net cash provided by (used in) financing activities (1,693) 59 111
Net increase (decrease) in cash and cash equivalents (1,207) 1,629 1,003
Cash and cash equivalents at beginning of year 4,665 3,036 2,033
Cash and cash equivalents at end of year $ 3,458 $4,665 $3,036
The accompanying Combined Notes to Consolidated Financial Statements are an integral part of these statements.
82