United Airlines 2011 Annual Report Download - page 36
Download and view the complete annual report
Please find page 36 of the 2011 United Airlines annual report below. You can navigate through the pages in the report by either clicking on the pages listed below, or by using the keyword search tool below to find specific information within the annual report.-
 1
1 -
2
-
3
-
4
-
5
-
6
-
7
-
8
-
9
-
10
-
11
-
12
-
13
-
14
-
15
-
16
-
17
-
18
-
19
-
20
-
21
-
22
-
23
-
24
-
25
-
 26
26 -
 27
27 -
 28
28 -
 29
29 -
 30
30 -
 31
31 -
 32
32 -
 33
33 -
 34
34 -
 35
35 -
 36
36 -
 37
37 -
 38
38 -
 39
39 -
 40
40 -
 41
41 -
 42
42 -
 43
43 -
 44
44 -
 45
45 -
 46
46 -
47
-
48
-
49
-
50
-
51
-
52
-
53
-
54
-
55
-
56
-
57
-
58
-
59
-
60
-
61
-
62
-
63
-
64
-
65
-
66
-
67
-
68
-
69
-
70
-
71
-
72
-
73
-
74
-
75
-
76
-
77
-
78
-
79
-
80
-
81
-
82
-
83
-
84
-
85
-
86
-
87
-
88
-
89
-
90
-
91
-
92
-
93
-
94
-
95
-
96
-
97
-
98
-
99
-
100
-
101
-
102
-
103
-
104
-
105
-
106
-
107
-
108
-
109
-
110
-
111
-
112
-
113
-
114
-
115
-
116
-
117
-
118
-
119
-
120
-
121
-
122
-
123
-
124
-
125
-
126
-
127
-
128
-
129
-
130
-
131
-
132
-
133
-
134
-
135
-
136
-
137
-
138
-
139
-
140
-
141
-
142
-
143
-
144
-
145
-
146
-
147
-
148
-
149
-
150
-
151
-
152
-
153
-
154
-
155
-
156
-
157
-
158
-
159
-
160
-
161
-
162
-
163
-
164
-
165
-
166
-
167
-
168
-
169
-
170
-
171
-
172
-
173
-
174
-
175
-
176
-
177
-
178
-
179
-
180
-
181
-
182
-
183
-
184
-
185
-
186
-
187
-
188
-
189
-
190
-
191
-
192
-
193
-
194
-
195
-
196
-
197
-
198
-
199
-
200
-
201
-
202
-
203
-
204
-
205
-
206
-
207
-
208
-
209
-
210
-
211
-
212
-
213
-
214
-
215
-
216
-
217
-
218
-
219
-
220
-
221
-
222
-
223
-
224
-
225
-
226
-
227
-
228
-
229
-
230
-
231
-
232
-
233
-
234
-
235
-
236
-
237
-
238
 |
 |
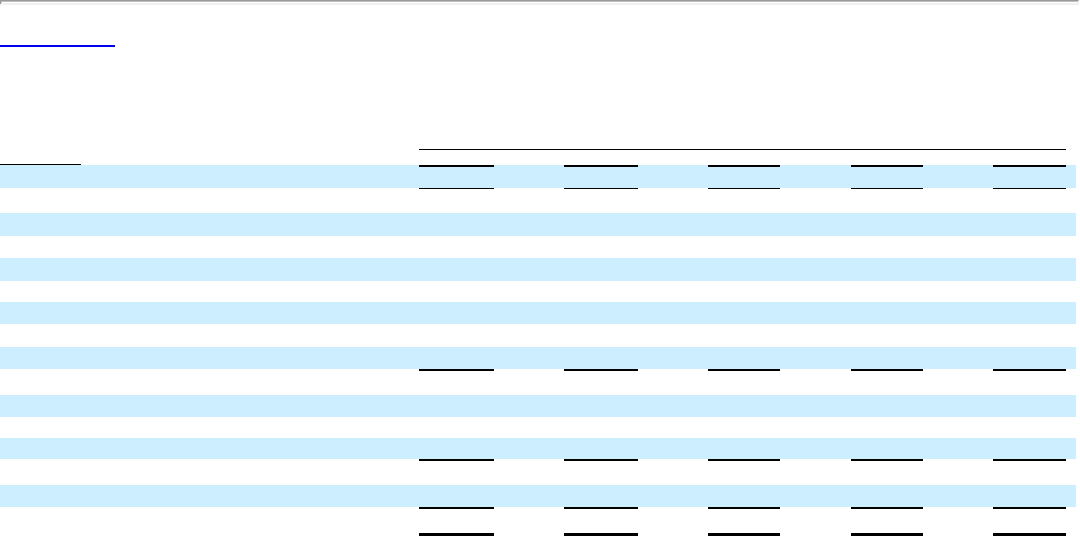
Table of Contents
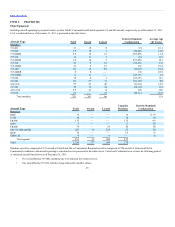
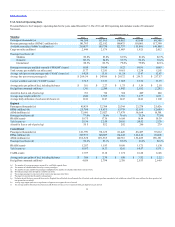
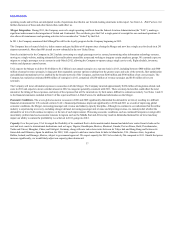
(a) The Company excludes business activities not associated with the generation of a seat mile (third-party businesses) from its core unit cost metrics. These third-party businesses include activities such as maintenance,
ground handling and catering services for third parties, and non-air frequent flyer mile redemption activity. The Company recorded approximately $240 million of third-party business expenses in 2011.
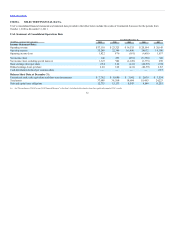
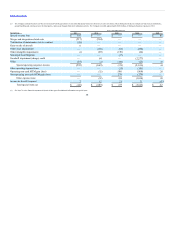
Special revenue item $107 $ — $ — $ — $ 45
Merger and integration-related costs (517) (564) — — —
Termination of maintenance service contract (58) — — — —
Gain on sale of aircraft 6 — — — —
Other asset impairments — (136) (93) (250) —
Other intangible impairments (4) (29) (150) (64) —
Municipal bond litigation — — (27) — —
Goodwill impairment (charge) credit — 64 — (2,277) —
Other (19) (4) (104) (25) 44
Special operating (expense) income (592) (669) (374) (2,616) 44
Other operating expense items — — (35) (191) —
Operating non-cash MTM gain (loss) — (32) 586 (568) 20
Non-operating non-cash MTM gain (loss) — — 279 (279) —
Other expense items — (32) 830 (1,038) 20
Income tax benefit (expense) 2 12 21 31 (47)
Total special items (a) $(483) $(689) $477 $(3,623) $62
(a) See Note 21 to the financial statements in Item 8 of this report for additional information on special items.
35