United Airlines 2011 Annual Report Download - page 39
Download and view the complete annual report
Please find page 39 of the 2011 United Airlines annual report below. You can navigate through the pages in the report by either clicking on the pages listed below, or by using the keyword search tool below to find specific information within the annual report.-
 1
1 -
2
-
3
-
4
-
5
-
6
-
7
-
8
-
9
-
10
-
11
-
12
-
13
-
14
-
15
-
16
-
17
-
18
-
19
-
20
-
21
-
22
-
23
-
24
-
25
-
26
-
27
-
28
-
 29
29 -
 30
30 -
 31
31 -
 32
32 -
 33
33 -
 34
34 -
 35
35 -
 36
36 -
 37
37 -
 38
38 -
 39
39 -
 40
40 -
 41
41 -
 42
42 -
 43
43 -
 44
44 -
 45
45 -
 46
46 -
 47
47 -
 48
48 -
 49
49 -
50
-
51
-
52
-
53
-
54
-
55
-
56
-
57
-
58
-
59
-
60
-
61
-
62
-
63
-
64
-
65
-
66
-
67
-
68
-
69
-
70
-
71
-
72
-
73
-
74
-
75
-
76
-
77
-
78
-
79
-
80
-
81
-
82
-
83
-
84
-
85
-
86
-
87
-
88
-
89
-
90
-
91
-
92
-
93
-
94
-
95
-
96
-
97
-
98
-
99
-
100
-
101
-
102
-
103
-
104
-
105
-
106
-
107
-
108
-
109
-
110
-
111
-
112
-
113
-
114
-
115
-
116
-
117
-
118
-
119
-
120
-
121
-
122
-
123
-
124
-
125
-
126
-
127
-
128
-
129
-
130
-
131
-
132
-
133
-
134
-
135
-
136
-
137
-
138
-
139
-
140
-
141
-
142
-
143
-
144
-
145
-
146
-
147
-
148
-
149
-
150
-
151
-
152
-
153
-
154
-
155
-
156
-
157
-
158
-
159
-
160
-
161
-
162
-
163
-
164
-
165
-
166
-
167
-
168
-
169
-
170
-
171
-
172
-
173
-
174
-
175
-
176
-
177
-
178
-
179
-
180
-
181
-
182
-
183
-
184
-
185
-
186
-
187
-
188
-
189
-
190
-
191
-
192
-
193
-
194
-
195
-
196
-
197
-
198
-
199
-
200
-
201
-
202
-
203
-
204
-
205
-
206
-
207
-
208
-
209
-
210
-
211
-
212
-
213
-
214
-
215
-
216
-
217
-
218
-
219
-
220
-
221
-
222
-
223
-
224
-
225
-
226
-
227
-
228
-
229
-
230
-
231
-
232
-
233
-
234
-
235
-
236
-
237
-
238
 |
 |

Table of Contents
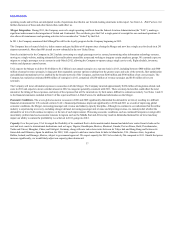
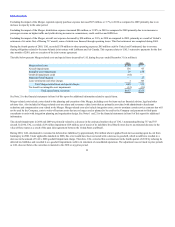
Additional Revenue-Generating and Cost Saving Measures. We offer, and intend to offer additional goods and services relating to air travel, a portion of
which will come from “unbundling” our current product and a portion of which will come from goods and services that we do not presently offer. The
revenues that we derive from these products and services, which are generally referred to as ancillary revenues, typically have higher margins than that of our
core transportation services and are an important element of our strategy to sustain the profitability that we achieved in 2011 and 2010. The “unbundling” of
our current products and services, as well as our additional value-added products, offer customers flexibility and choice in selecting the products and services
they are willing to purchase. Additionally, we expect to continue to invest in technology that is designed to both assist customers with self-service efficiently
and allow us to make better operational decisions, while lowering our operating costs.
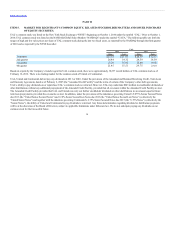
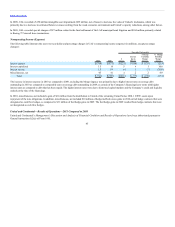
Fuel Costs. Fuel prices continued to be volatile in 2011. UAL’s average aircraft fuel price per gallon including related taxes was $3.06 in 2011 as compared to
$2.39 in 2010. If fuel prices rise significantly from their current levels, we may be unable to raise fares or other fees sufficiently to fully offset our increased
costs. In addition, high fuel prices may impair our ability to sustain the profitability we achieved in 2011 and 2010. Based on projected fuel consumption in
2012, a one dollar change in the price of a barrel of crude oil would change UAL’s annual fuel expense by approximately $95 million. To protect against
increases in the prices of fuel, the Company routinely hedges a portion of its future fuel requirements.
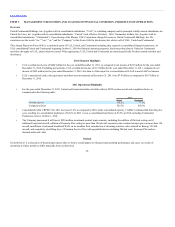
Labor Costs. As of December 31, 2011, the Company had approximately 72% of employees represented by unions. We are in the process of negotiating
amended collective bargaining agreements with our employee groups. The Company cannot predict the outcome of negotiations with its unionized employee
groups, although significant increases in the pay and benefits resulting from new collective bargaining agreements could have an adverse financial impact on
the Company.
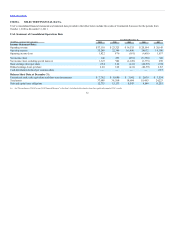
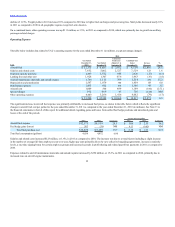
In this section, we compare UAL’s results of operations for the year ended December 31, 2011 with UAL’s results on a combined basis for the year ended
December 31, 2010. UAL’s results of operations for 2010 on a combined basis consist of (1) UAL’s results of operations for 2010, which includes
Continental’s results from October 1 to December 31, 2010; and (2) Continental’s results from January 1 to September 30, 2010. Given the significant level of
integration activity in 2011, we believe this presentation of the 2010 financial results provides a more meaningful basis for comparing UAL’s financial
performance in 2011 and 2010. This presentation differs from the comparison of 2010 and 2009 results, which compares UAL’s financial performance year-
over-year excluding the Merger impact in 2010, represented by Continental Successor results in the fourth quarter of 2010. Non-GAAP financial measures are
presented because they provide management and investors with the ability to measure and monitor UAL’s performance on a consistent basis.
38