United Airlines 2011 Annual Report Download - page 121
Download and view the complete annual report
Please find page 121 of the 2011 United Airlines annual report below. You can navigate through the pages in the report by either clicking on the pages listed below, or by using the keyword search tool below to find specific information within the annual report.-
 1
1 -
2
-
3
-
4
-
5
-
6
-
7
-
8
-
9
-
10
-
11
-
12
-
13
-
14
-
15
-
16
-
17
-
18
-
19
-
20
-
21
-
22
-
23
-
24
-
25
-
26
-
27
-
28
-
29
-
30
-
31
-
32
-
33
-
34
-
35
-
36
-
37
-
38
-
39
-
40
-
41
-
42
-
43
-
44
-
45
-
46
-
47
-
48
-
49
-
50
-
51
-
52
-
53
-
54
-
55
-
56
-
57
-
58
-
59
-
60
-
61
-
62
-
63
-
64
-
65
-
66
-
67
-
68
-
69
-
70
-
71
-
72
-
73
-
74
-
75
-
76
-
77
-
78
-
79
-
80
-
81
-
82
-
83
-
84
-
85
-
86
-
87
-
88
-
89
-
90
-
91
-
92
-
93
-
94
-
95
-
96
-
97
-
98
-
99
-
100
-
101
-
102
-
103
-
104
-
105
-
106
-
107
-
108
-
109
-
110
-
 111
111 -
 112
112 -
 113
113 -
 114
114 -
 115
115 -
 116
116 -
 117
117 -
 118
118 -
 119
119 -
 120
120 -
 121
121 -
 122
122 -
 123
123 -
 124
124 -
 125
125 -
 126
126 -
 127
127 -
 128
128 -
 129
129 -
 130
130 -
 131
131 -
132
-
133
-
134
-
135
-
136
-
137
-
138
-
139
-
140
-
141
-
142
-
143
-
144
-
145
-
146
-
147
-
148
-
149
-
150
-
151
-
152
-
153
-
154
-
155
-
156
-
157
-
158
-
159
-
160
-
161
-
162
-
163
-
164
-
165
-
166
-
167
-
168
-
169
-
170
-
171
-
172
-
173
-
174
-
175
-
176
-
177
-
178
-
179
-
180
-
181
-
182
-
183
-
184
-
185
-
186
-
187
-
188
-
189
-
190
-
191
-
192
-
193
-
194
-
195
-
196
-
197
-
198
-
199
-
200
-
201
-
202
-
203
-
204
-
205
-
206
-
207
-
208
-
209
-
210
-
211
-
212
-
213
-
214
-
215
-
216
-
217
-
218
-
219
-
220
-
221
-
222
-
223
-
224
-
225
-
226
-
227
-
228
-
229
-
230
-
231
-
232
-
233
-
234
-
235
-
236
-
237
-
238
 |
 |

Table of Contents
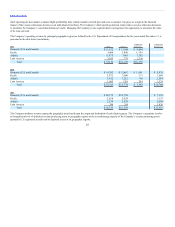
Each of these investments are stable value investment products structured to provide investment
income.
Alternative investments consist primarily of investments in hedge fund and private equity interests.
Other investments consist primarily of investments in currency and commodity commingled funds.
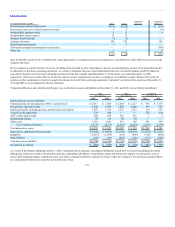
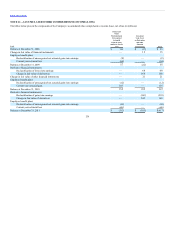
The reconciliation of our defined benefit plan assets measured at fair value using unobservable inputs (Level 3) for the years ended December 31, 2011 and
2010 is as follows (in millions):
Balance at beginning of year $250 $100 $ 150 $99 $99 $ 128
Assumed in Merger — — — 139 — —
Actual return on plan assets:
Unrealized gains (losses) relating to assets still held at year end 6 3 3 13 2 21
Purchases, sales, issuances and settlements (net) (7) (3) (4) (1) (1) 1
Balance at end of year $249 $100 $ 149 $250 $100 $ 150
(a) Continental in 2010 represents combined Predecessor and Successor.
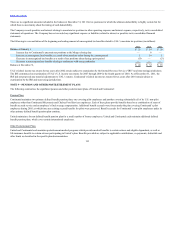
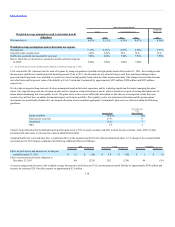
Funding requirements for tax-qualified defined benefit pension plans are determined by government regulations. The Company’s contributions reflected above
have satisfied its required contributions through the 2011 calendar year. Expected 2012 employer contributions to all of the Company’s pension and
postretirement plans are as follows (in millions):
UAL $195 $ 145
United 11 129
Continental 184 16
120