United Airlines 2011 Annual Report Download - page 37
Download and view the complete annual report
Please find page 37 of the 2011 United Airlines annual report below. You can navigate through the pages in the report by either clicking on the pages listed below, or by using the keyword search tool below to find specific information within the annual report.-
 1
1 -
2
-
3
-
4
-
5
-
6
-
7
-
8
-
9
-
10
-
11
-
12
-
13
-
14
-
15
-
16
-
17
-
18
-
19
-
20
-
21
-
22
-
23
-
24
-
25
-
26
-
 27
27 -
 28
28 -
 29
29 -
 30
30 -
 31
31 -
 32
32 -
 33
33 -
 34
34 -
 35
35 -
 36
36 -
 37
37 -
 38
38 -
 39
39 -
 40
40 -
 41
41 -
 42
42 -
 43
43 -
 44
44 -
 45
45 -
 46
46 -
 47
47 -
48
-
49
-
50
-
51
-
52
-
53
-
54
-
55
-
56
-
57
-
58
-
59
-
60
-
61
-
62
-
63
-
64
-
65
-
66
-
67
-
68
-
69
-
70
-
71
-
72
-
73
-
74
-
75
-
76
-
77
-
78
-
79
-
80
-
81
-
82
-
83
-
84
-
85
-
86
-
87
-
88
-
89
-
90
-
91
-
92
-
93
-
94
-
95
-
96
-
97
-
98
-
99
-
100
-
101
-
102
-
103
-
104
-
105
-
106
-
107
-
108
-
109
-
110
-
111
-
112
-
113
-
114
-
115
-
116
-
117
-
118
-
119
-
120
-
121
-
122
-
123
-
124
-
125
-
126
-
127
-
128
-
129
-
130
-
131
-
132
-
133
-
134
-
135
-
136
-
137
-
138
-
139
-
140
-
141
-
142
-
143
-
144
-
145
-
146
-
147
-
148
-
149
-
150
-
151
-
152
-
153
-
154
-
155
-
156
-
157
-
158
-
159
-
160
-
161
-
162
-
163
-
164
-
165
-
166
-
167
-
168
-
169
-
170
-
171
-
172
-
173
-
174
-
175
-
176
-
177
-
178
-
179
-
180
-
181
-
182
-
183
-
184
-
185
-
186
-
187
-
188
-
189
-
190
-
191
-
192
-
193
-
194
-
195
-
196
-
197
-
198
-
199
-
200
-
201
-
202
-
203
-
204
-
205
-
206
-
207
-
208
-
209
-
210
-
211
-
212
-
213
-
214
-
215
-
216
-
217
-
218
-
219
-
220
-
221
-
222
-
223
-
224
-
225
-
226
-
227
-
228
-
229
-
230
-
231
-
232
-
233
-
234
-
235
-
236
-
237
-
238
 |
 |

Table of Contents
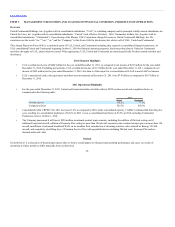
United Continental Holdings, Inc. (together with its consolidated subsidiaries, “UAL”) is a holding company and its principal, wholly-owned subsidiaries are
United Air Lines, Inc. (together with its consolidated subsidiaries, “United”) and, effective October 1, 2010, Continental Airlines, Inc. (together with its
consolidated subsidiaries, “Continental”). Upon closing of the Merger, UAL Corporation changed its name to United Continental Holdings, Inc. We
sometimes use the words “we,” “our,” “us,” and the “Company” in this Form 10-K for disclosures that relate to all of UAL, United and Continental.
This Annual Report on Form 10-K is a combined report of UAL, United, and Continental including their respective consolidated financial statements. As
UAL consolidated United and Continental beginning October 1, 2010 for financial statement purposes, disclosures that relate to United or Continental
activities also apply to UAL, unless otherwise noted. When appropriate, UAL, United and Continental are named specifically for their related activities and
disclosures.
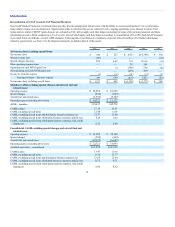
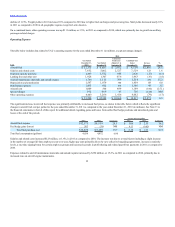
• UAL recorded net income of $840 million for the year ended December 31, 2011, as compared to net income of $253 million for the year ended
December 31, 2010. Excluding special items, UAL recorded net income of $1.3 billion for the year ended December 31, 2011, compared to net
income of $942 million for the year ended December 31, 2010. See Item 6 of this report for a reconciliation of GAAP to non-GAAP net income.
• UAL’s unrestricted cash, cash equivalents and short-term investments at December 31, 2011 was $7.8 billion as compared to $8.7 billion at
December 31, 2010.
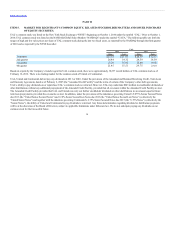
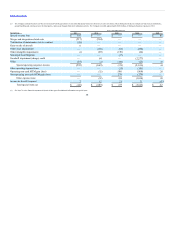
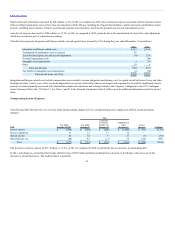
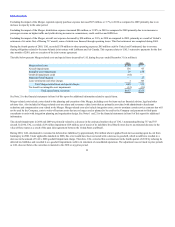
• For the year ended December 31, 2011, United and Continental achieved solid results in DOT on-time arrival and completion factor, as
summarized in the following table:
On-time arrival 80.2% 77.1%
Completion factor 98.5% 98.6%
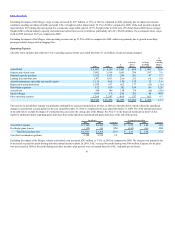
• Consolidated traffic (“RPMs”) for 2011 decreased 1.4% as compared to 2010, while consolidated capacity (“ASMs”) remained flat from the prior
year, resulting in a consolidated load factor of 82.2% in 2011 versus a consolidated load factor of 83.2% in 2010, including Continental
Predecessor prior to October 1, 2010.
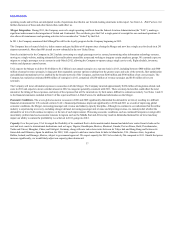
• The Company announced it will invest $550 million in onboard product improvements, including the addition of flat-bed seating on 62
additional long-haul aircraft, addition of Economy Plus seating to more than 300 aircraft, increase in the overhead storage space on more than 150
aircraft, installation of advanced broadband Wi-Fi on its mainline fleet, introduction of streaming wireless video onboard its Boeing 747-400
aircraft, and completely retrofitting its p.s. (Premium Service) fleet with upgraded interiors including flat-bed seats, Economy Plus and on-
demand audio and video.
Set forth below is a discussion of the principal matters that we believe could impact our financial and operating performance and cause our results of
operations in future periods to differ materially from our historical
36