United Airlines 2011 Annual Report Download - page 94
Download and view the complete annual report
Please find page 94 of the 2011 United Airlines annual report below. You can navigate through the pages in the report by either clicking on the pages listed below, or by using the keyword search tool below to find specific information within the annual report.-
 1
1 -
2
-
3
-
4
-
5
-
6
-
7
-
8
-
9
-
10
-
11
-
12
-
13
-
14
-
15
-
16
-
17
-
18
-
19
-
20
-
21
-
22
-
23
-
24
-
25
-
26
-
27
-
28
-
29
-
30
-
31
-
32
-
33
-
34
-
35
-
36
-
37
-
38
-
39
-
40
-
41
-
42
-
43
-
44
-
45
-
46
-
47
-
48
-
49
-
50
-
51
-
52
-
53
-
54
-
55
-
56
-
57
-
58
-
59
-
60
-
61
-
62
-
63
-
64
-
65
-
66
-
67
-
68
-
69
-
70
-
71
-
72
-
73
-
74
-
75
-
76
-
77
-
78
-
79
-
80
-
81
-
82
-
83
-
 84
84 -
 85
85 -
 86
86 -
 87
87 -
 88
88 -
 89
89 -
 90
90 -
 91
91 -
 92
92 -
 93
93 -
 94
94 -
 95
95 -
 96
96 -
 97
97 -
 98
98 -
 99
99 -
 100
100 -
 101
101 -
 102
102 -
 103
103 -
 104
104 -
105
-
106
-
107
-
108
-
109
-
110
-
111
-
112
-
113
-
114
-
115
-
116
-
117
-
118
-
119
-
120
-
121
-
122
-
123
-
124
-
125
-
126
-
127
-
128
-
129
-
130
-
131
-
132
-
133
-
134
-
135
-
136
-
137
-
138
-
139
-
140
-
141
-
142
-
143
-
144
-
145
-
146
-
147
-
148
-
149
-
150
-
151
-
152
-
153
-
154
-
155
-
156
-
157
-
158
-
159
-
160
-
161
-
162
-
163
-
164
-
165
-
166
-
167
-
168
-
169
-
170
-
171
-
172
-
173
-
174
-
175
-
176
-
177
-
178
-
179
-
180
-
181
-
182
-
183
-
184
-
185
-
186
-
187
-
188
-
189
-
190
-
191
-
192
-
193
-
194
-
195
-
196
-
197
-
198
-
199
-
200
-
201
-
202
-
203
-
204
-
205
-
206
-
207
-
208
-
209
-
210
-
211
-
212
-
213
-
214
-
215
-
216
-
217
-
218
-
219
-
220
-
221
-
222
-
223
-
224
-
225
-
226
-
227
-
228
-
229
-
230
-
231
-
232
-
233
-
234
-
235
-
236
-
237
-
238
 |
 |

Table of Contents
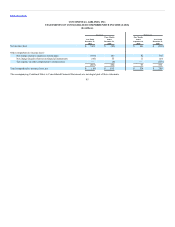
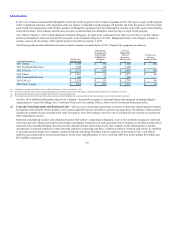
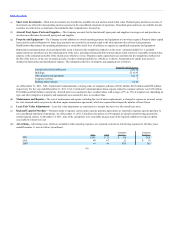
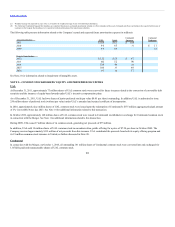
Generally, as compared to the historical accounting policy, the new accounting policy decreases the value of miles that the Company records as deferred
revenue and increases the passenger revenue recorded at the time air transportation is provided. The application of the new accounting method to
passenger ticket transactions resulted in the following estimated increases to revenue (in millions, except per share amounts):
Operating revenue $340 $215 $125
Per basic share 1.03 NM NM
Per diluted share 0.89 NM NM
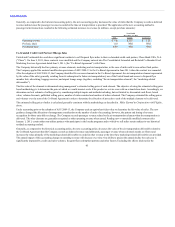
United and Continental also each have significant contracts to sell frequent flyer miles to their co-branded credit card partner, Chase Bank USA, N.A.
(“Chase”). On June 9, 2011, these contracts were modified and the Company entered into The Consolidated Amended and Restated Co-Branded Card
Marketing Services Agreement dated June 9, 2011, (the “Co-Brand Agreement”) with Chase.
The Company historically had two primary revenue elements, marketing and air transportation, in the case of miles sold to non-airline third parties.
The Company applied the material modification provisions of ASU 2009-13 to the Co-Brand Agreement in June 2011 when the contract was amended.
After the adoption of ASU 2009-13, the Company identified five revenue elements in the Co-Brand Agreement: the air transportation element represented
by the value of the mile (generally resulting from its redemption for future air transportation); use of the United brand and access to frequent flyer
member lists; advertising; baggage services; and airport lounge usage (together, excluding “the air transportation element”, the “marketing-related
deliverables”).
The fair value of the elements is determined using management’s estimated selling price of each element. The objective of using the estimated selling price
based methodology is to determine the price at which we would transact a sale if the product or service were sold on a stand-alone basis. Accordingly, we
determine our best estimate of selling price by considering multiple inputs and methods including, but not limited to, discounted cash flows, brand
value, volume discounts, published selling prices, number of miles awarded and number of miles redeemed. The Company estimated the selling prices
and volumes over the term of the Co-Brand Agreement in order to determine the allocation of proceeds to each of the multiple elements to be delivered.
The estimated selling price of miles is calculated generally consistent with the methodology as described in ,
above.
Under accounting prior to the adoption of ASU 2009-13, the Company used an equivalent ticket value to determine the fair value of miles. The new
guidance changed the allocation of arrangement consideration to the number of units of accounting; however, the pattern and timing of revenue
recognition for those units did not change. The Company records passenger revenue related to the air transportation element when the transportation is
delivered. The other elements are generally recognized as other operating revenue when earned. Pending new or materially modified contracts after
January 1, 2011, certain other non-airline partners who participate in the loyalty programs and to which we sell miles remain subject to our historical
residual accounting method.
Generally, as compared to the historical accounting policy, the new accounting policy decreases the value of the air transportation deliverable related to
the Co-Brand Agreement that the Company records as deferred revenue (and ultimately, passenger revenue when redeemed awards are flown) and
increases the value primarily of the marketing-related deliverables recorded in other revenue at the time these marketing-related deliverables are provided.
The annual impact of this accounting change on operating revenue will decrease over time. Our ability to project the annual decline for each year is
significantly impacted by credit card sales volumes, frequent flyer redemption patterns and other factors. Excluding the effects disclosed in the
93