United Airlines 2011 Annual Report Download - page 130
Download and view the complete annual report
Please find page 130 of the 2011 United Airlines annual report below. You can navigate through the pages in the report by either clicking on the pages listed below, or by using the keyword search tool below to find specific information within the annual report.-
 1
1 -
2
-
3
-
4
-
5
-
6
-
7
-
8
-
9
-
10
-
11
-
12
-
13
-
14
-
15
-
16
-
17
-
18
-
19
-
20
-
21
-
22
-
23
-
24
-
25
-
26
-
27
-
28
-
29
-
30
-
31
-
32
-
33
-
34
-
35
-
36
-
37
-
38
-
39
-
40
-
41
-
42
-
43
-
44
-
45
-
46
-
47
-
48
-
49
-
50
-
51
-
52
-
53
-
54
-
55
-
56
-
57
-
58
-
59
-
60
-
61
-
62
-
63
-
64
-
65
-
66
-
67
-
68
-
69
-
70
-
71
-
72
-
73
-
74
-
75
-
76
-
77
-
78
-
79
-
80
-
81
-
82
-
83
-
84
-
85
-
86
-
87
-
88
-
89
-
90
-
91
-
92
-
93
-
94
-
95
-
96
-
97
-
98
-
99
-
100
-
101
-
102
-
103
-
104
-
105
-
106
-
107
-
108
-
109
-
110
-
111
-
112
-
113
-
114
-
115
-
116
-
117
-
118
-
119
-
 120
120 -
 121
121 -
 122
122 -
 123
123 -
 124
124 -
 125
125 -
 126
126 -
 127
127 -
 128
128 -
 129
129 -
 130
130 -
 131
131 -
 132
132 -
 133
133 -
 134
134 -
 135
135 -
 136
136 -
 137
137 -
 138
138 -
 139
139 -
 140
140 -
141
-
142
-
143
-
144
-
145
-
146
-
147
-
148
-
149
-
150
-
151
-
152
-
153
-
154
-
155
-
156
-
157
-
158
-
159
-
160
-
161
-
162
-
163
-
164
-
165
-
166
-
167
-
168
-
169
-
170
-
171
-
172
-
173
-
174
-
175
-
176
-
177
-
178
-
179
-
180
-
181
-
182
-
183
-
184
-
185
-
186
-
187
-
188
-
189
-
190
-
191
-
192
-
193
-
194
-
195
-
196
-
197
-
198
-
199
-
200
-
201
-
202
-
203
-
204
-
205
-
206
-
207
-
208
-
209
-
210
-
211
-
212
-
213
-
214
-
215
-
216
-
217
-
218
-
219
-
220
-
221
-
222
-
223
-
224
-
225
-
226
-
227
-
228
-
229
-
230
-
231
-
232
-
233
-
234
-
235
-
236
-
237
-
238
 |
 |

Table of Contents
option under applicable accounting standards for the put right, with changes in the fair value of the auction rate securities and the underlying put right
recognized in earnings currently. Continental recognized gains on the sales using the specific identification method. The gains were substantially offset by the
cancellation of the related put rights. The net gains are included in other nonoperating income (expense) in the Continental Predecessor statement of consolidated
operations and were not material. The Company did not hold any put rights as of December 31, 2010. In 2011, Continental sold, at par, auction rate securities
having a par value of $10 million and recorded an immaterial gain in nonoperating income (expense).
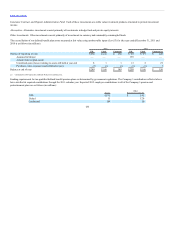
Derivative instruments and investments presented in the tables above have the same fair value as their carrying value. The table below presents the carrying
values and estimated fair values of financial instruments not presented in the tables above for the years ended December 31 (in millions):
UAL debt $11,682 $11,992 $13,845 $14,995
United debt 5,745 5,630 7,026 7,350
Continental debt 5,528 5,503 6,401 6,663
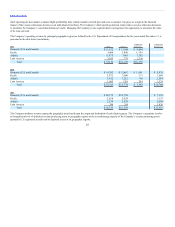
Fair value of the Company’s financial instruments was determined as follows:
The carrying amounts approximate fair value because of the short-term maturity of these assets and
liabilities. These assets have maturities of less than one year except for the EETCs, auction rate
securities and corporate debt.
Fair value is based on (a) the trading prices of the investment or similar instruments, (b) an income
approach, which uses valuation techniques to convert future amounts into a single present amount
based on current market expectations about those future amounts when observable trading prices are
not available, or (c) internally-developed models of the expected future cash flows related to the
securities.
Derivative contracts are privately negotiated contracts and are not exchange traded. Fair value
measurements are estimated with option pricing models that employ observable inputs. Inputs to the
valuation models include contractual terms, market prices, yield curves, fuel price curves and
measures of volatility, among others.
Fair value is determined with a formula utilizing observable inputs. Significant inputs to the valuation
models include contractual terms, risk-free interest rates and forward exchange rates.
Fair values were based on either market prices or the discounted amount of future cash flows using our
current incremental rate of borrowing for similar liabilities.
The Company used a binomial lattice model to value the conversion options and the supplemental
derivative assets. Significant binomial model inputs that are not objectively determinable include
volatility and discount rate.
129