United Airlines 2011 Annual Report Download - page 44
Download and view the complete annual report
Please find page 44 of the 2011 United Airlines annual report below. You can navigate through the pages in the report by either clicking on the pages listed below, or by using the keyword search tool below to find specific information within the annual report.-
 1
1 -
2
-
3
-
4
-
5
-
6
-
7
-
8
-
9
-
10
-
11
-
12
-
13
-
14
-
15
-
16
-
17
-
18
-
19
-
20
-
21
-
22
-
23
-
24
-
25
-
26
-
27
-
28
-
29
-
30
-
31
-
32
-
33
-
 34
34 -
 35
35 -
 36
36 -
 37
37 -
 38
38 -
 39
39 -
 40
40 -
 41
41 -
 42
42 -
 43
43 -
 44
44 -
 45
45 -
 46
46 -
 47
47 -
 48
48 -
 49
49 -
 50
50 -
 51
51 -
 52
52 -
 53
53 -
 54
54 -
55
-
56
-
57
-
58
-
59
-
60
-
61
-
62
-
63
-
64
-
65
-
66
-
67
-
68
-
69
-
70
-
71
-
72
-
73
-
74
-
75
-
76
-
77
-
78
-
79
-
80
-
81
-
82
-
83
-
84
-
85
-
86
-
87
-
88
-
89
-
90
-
91
-
92
-
93
-
94
-
95
-
96
-
97
-
98
-
99
-
100
-
101
-
102
-
103
-
104
-
105
-
106
-
107
-
108
-
109
-
110
-
111
-
112
-
113
-
114
-
115
-
116
-
117
-
118
-
119
-
120
-
121
-
122
-
123
-
124
-
125
-
126
-
127
-
128
-
129
-
130
-
131
-
132
-
133
-
134
-
135
-
136
-
137
-
138
-
139
-
140
-
141
-
142
-
143
-
144
-
145
-
146
-
147
-
148
-
149
-
150
-
151
-
152
-
153
-
154
-
155
-
156
-
157
-
158
-
159
-
160
-
161
-
162
-
163
-
164
-
165
-
166
-
167
-
168
-
169
-
170
-
171
-
172
-
173
-
174
-
175
-
176
-
177
-
178
-
179
-
180
-
181
-
182
-
183
-
184
-
185
-
186
-
187
-
188
-
189
-
190
-
191
-
192
-
193
-
194
-
195
-
196
-
197
-
198
-
199
-
200
-
201
-
202
-
203
-
204
-
205
-
206
-
207
-
208
-
209
-
210
-
211
-
212
-
213
-
214
-
215
-
216
-
217
-
218
-
219
-
220
-
221
-
222
-
223
-
224
-
225
-
226
-
227
-
228
-
229
-
230
-
231
-
232
-
233
-
234
-
235
-
236
-
237
-
238
 |
 |

Table of Contents
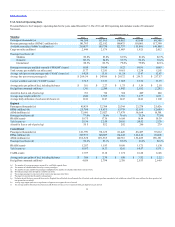
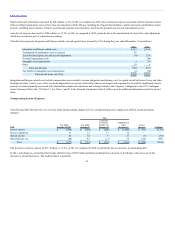
Excluding the impact of the Merger, cargo revenue increased by $177 million, or 33%, in 2010 as compared to 2009, primarily due to improved economic
conditions resulting in improved traffic and yield. UAL’s freight ton miles improved by 22.1% in 2010 as compared to 2009, while mail ton miles dropped
approximately 8.8% during the same period, for a composite cargo traffic gain of 18.3%. Freight yields in 2010 were 15% better than in 2009 due to stronger
freight traffic, reduced industry capacity and numerous tactical rate recovery initiatives, particularly in UAL’s Pacific markets. On a composite basis, cargo
yield in 2010 increased 12.6% as compared to 2009.
Excluding the impact of the Merger, other operating revenue was up 23.5% in 2010 as compared to 2009, which was primarily due to growth in ancillary
passenger-related charges such as baggage fees.
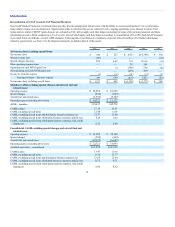
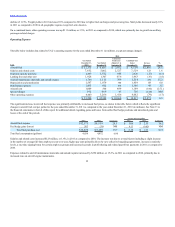
Operating Expense
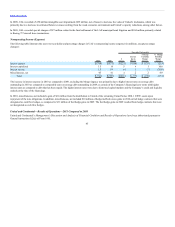
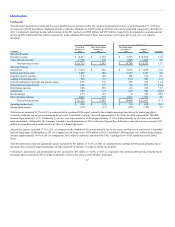
The table below includes data related to UAL’s operating expense for the year ended December 31 (in millions, except percentage changes):
Aircraft fuel $6,687 $4,204 $2,483 $986 $1,497 35.6
Salaries and related costs 5,002 3,919 1,083 786 297 7.6
Regional capacity purchase 1,812 1,523 289 202 87 5.7
Landing fees and other rent 1,307 1,011 296 231 65 6.4
Aircraft maintenance materials and outside repairs 1,115 965 150 135 15 1.6
Depreciation and amortization 1,079 917 162 177 (15) (1.6)
Distribution expenses 912 670 242 156 86 12.8
Aircraft rent 500 346 154 174 (20) (5.8)
Special charges 669 374 295 201 94 NM
Other operating expenses 3,266 2,567 699 537 162 6.3
$22,349 $16,496 $5,853 $3,585 $2,268 13.7
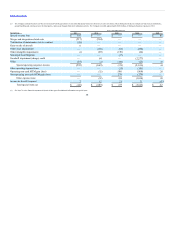
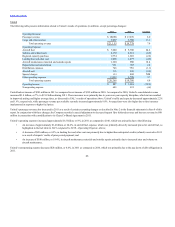
The increase in aircraft fuel expense was primarily attributable to increased market prices for fuel, as shown in the table below which reflects the significant
changes in aircraft fuel cost per gallon for the year ended December 31, 2010 as compared to the year ended December 31, 2009. The 2010 amounts presented
in the table below exclude the impact of Continental Successor after the closing date of the Merger. See Note 13 to the financial statements in Item 8 of this
report for additional details regarding gains and losses from settled positions and unrealized gains and losses at the end of the period.
Aircraft fuel expense $ 5,700 $4,204 35.6 $ 2.39 $1.80 32.8
Fuel hedge gains (losses) (119) 104 NM (0.05) 0.04 NM
Total fuel purchase cost $5,581 $4,308 29.5 $2.34 $1.84 27.2
Total fuel consumption (gallons) 2,388 2,338 2.1
Excluding the impact of the Merger, salaries and related costs increased $297 million, or 7.6%, in 2010 as compared to 2009. The increase was primarily due
to increased accruals for profit sharing and other annual incentive plans. In 2010, UAL’s accrual for profit sharing was $166 million. Expense for the plan
was not accrued in 2009 as the profit sharing and other incentive plan payouts were not earned based on UAL’s adjusted pre-tax losses.
43