United Airlines 2011 Annual Report Download - page 35
Download and view the complete annual report
Please find page 35 of the 2011 United Airlines annual report below. You can navigate through the pages in the report by either clicking on the pages listed below, or by using the keyword search tool below to find specific information within the annual report.-
 1
1 -
2
-
3
-
4
-
5
-
6
-
7
-
8
-
9
-
10
-
11
-
12
-
13
-
14
-
15
-
16
-
17
-
18
-
19
-
20
-
21
-
22
-
23
-
24
-
 25
25 -
 26
26 -
 27
27 -
 28
28 -
 29
29 -
 30
30 -
 31
31 -
 32
32 -
 33
33 -
 34
34 -
 35
35 -
 36
36 -
 37
37 -
 38
38 -
 39
39 -
 40
40 -
 41
41 -
 42
42 -
 43
43 -
 44
44 -
 45
45 -
46
-
47
-
48
-
49
-
50
-
51
-
52
-
53
-
54
-
55
-
56
-
57
-
58
-
59
-
60
-
61
-
62
-
63
-
64
-
65
-
66
-
67
-
68
-
69
-
70
-
71
-
72
-
73
-
74
-
75
-
76
-
77
-
78
-
79
-
80
-
81
-
82
-
83
-
84
-
85
-
86
-
87
-
88
-
89
-
90
-
91
-
92
-
93
-
94
-
95
-
96
-
97
-
98
-
99
-
100
-
101
-
102
-
103
-
104
-
105
-
106
-
107
-
108
-
109
-
110
-
111
-
112
-
113
-
114
-
115
-
116
-
117
-
118
-
119
-
120
-
121
-
122
-
123
-
124
-
125
-
126
-
127
-
128
-
129
-
130
-
131
-
132
-
133
-
134
-
135
-
136
-
137
-
138
-
139
-
140
-
141
-
142
-
143
-
144
-
145
-
146
-
147
-
148
-
149
-
150
-
151
-
152
-
153
-
154
-
155
-
156
-
157
-
158
-
159
-
160
-
161
-
162
-
163
-
164
-
165
-
166
-
167
-
168
-
169
-
170
-
171
-
172
-
173
-
174
-
175
-
176
-
177
-
178
-
179
-
180
-
181
-
182
-
183
-
184
-
185
-
186
-
187
-
188
-
189
-
190
-
191
-
192
-
193
-
194
-
195
-
196
-
197
-
198
-
199
-
200
-
201
-
202
-
203
-
204
-
205
-
206
-
207
-
208
-
209
-
210
-
211
-
212
-
213
-
214
-
215
-
216
-
217
-
218
-
219
-
220
-
221
-
222
-
223
-
224
-
225
-
226
-
227
-
228
-
229
-
230
-
231
-
232
-
233
-
234
-
235
-
236
-
237
-
238
 |
 |

Table of Contents
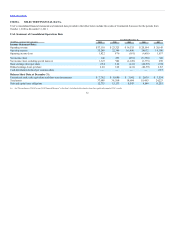
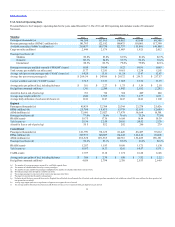
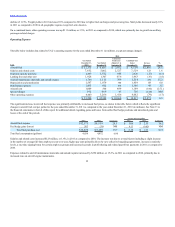
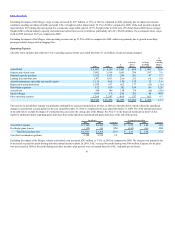
Non-GAAP financial measures are presented because they provide management and investors with the ability to measure and monitor UAL’s performance
using similar criteria on a consistent basis. Special items relate to activities that are not central to UAL’s ongoing operations or are unusual in nature. Fuel
hedge mark to market (“MTM”) gains (losses) are excluded as UAL did not apply cash flow hedge accounting for many of the periods presented, and these
adjustments provide a better comparison to UAL’s peers, most of which apply cash flow hedge accounting. A reconciliation of GAAP to Non-GAAP measures
is provided below (in millions, except CASM amounts). Following this reconciliation is a summary of special items (in millions). For further information
related to special items, see Note 21 to the financial statements included in Item 8 of this report.
Net income (loss) $840 $ 253 $(651) $(5,396) $360
Special revenue item (107) — — — (45)
Special charges (income) 592 669 374 2,616 (44)
Other operating expense items — — 35 191 —
Operating non-cash MTM (gain) loss — 32 (586) 568 (20)
Non-operating non-cash MTM (gain) loss — — (279) 279 —
Income tax (benefit) expense (2) (12) (21) (31) 47
Total special items—(income) expense 483 689 (477) 3,623 (62)
Net income (loss) excluding special items $1,323 $ 942 $ (1,128) $(1,773) $298
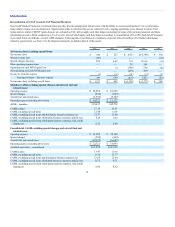
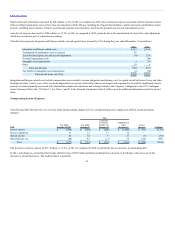
Operating expense $28,850 $18,228
Special charges (592) (669)
Aircraft fuel and related taxes (9,936) (5,387)
Operating expense excluding above items $ 18,322 $12,172
ASMs—mainline 219,437 145,738
CASM (cents) 13.15 12.51
CASM, excluding special items 12.88 12.03
CASM, excluding special items and third-party business expenses (a) 12.77 11.88
CASM, excluding special items, third-party business expenses and fuel (a) 8.24 8.20
CASM, excluding special items, third-party business expenses, fuel, profit
sharing (a) 8.12 8.09
Operating expense $35,288 $ 22,349
Special charges (592) (669)
Aircraft fuel and related taxes (12,375) (6,687)
Operating expense excluding above items $ 22,321 $14,993
Available seat miles—consolidated 252,528 169,565
CASM (cents) 13.97 13.18
CASM, excluding special items 13.74 12.77
CASM, excluding special items and third-party business expenses (a) 13.65 12.64
CASM, excluding special items, third-party business expenses and fuel (a) 8.75 8.71
CASM, excluding special items, third-party business expenses, fuel, profit
sharing (a) 8.64 8.62
34