United Airlines 2011 Annual Report Download - page 129
Download and view the complete annual report
Please find page 129 of the 2011 United Airlines annual report below. You can navigate through the pages in the report by either clicking on the pages listed below, or by using the keyword search tool below to find specific information within the annual report.-
 1
1 -
2
-
3
-
4
-
5
-
6
-
7
-
8
-
9
-
10
-
11
-
12
-
13
-
14
-
15
-
16
-
17
-
18
-
19
-
20
-
21
-
22
-
23
-
24
-
25
-
26
-
27
-
28
-
29
-
30
-
31
-
32
-
33
-
34
-
35
-
36
-
37
-
38
-
39
-
40
-
41
-
42
-
43
-
44
-
45
-
46
-
47
-
48
-
49
-
50
-
51
-
52
-
53
-
54
-
55
-
56
-
57
-
58
-
59
-
60
-
61
-
62
-
63
-
64
-
65
-
66
-
67
-
68
-
69
-
70
-
71
-
72
-
73
-
74
-
75
-
76
-
77
-
78
-
79
-
80
-
81
-
82
-
83
-
84
-
85
-
86
-
87
-
88
-
89
-
90
-
91
-
92
-
93
-
94
-
95
-
96
-
97
-
98
-
99
-
100
-
101
-
102
-
103
-
104
-
105
-
106
-
107
-
108
-
109
-
110
-
111
-
112
-
113
-
114
-
115
-
116
-
117
-
118
-
 119
119 -
 120
120 -
 121
121 -
 122
122 -
 123
123 -
 124
124 -
 125
125 -
 126
126 -
 127
127 -
 128
128 -
 129
129 -
 130
130 -
 131
131 -
 132
132 -
 133
133 -
 134
134 -
 135
135 -
 136
136 -
 137
137 -
 138
138 -
 139
139 -
140
-
141
-
142
-
143
-
144
-
145
-
146
-
147
-
148
-
149
-
150
-
151
-
152
-
153
-
154
-
155
-
156
-
157
-
158
-
159
-
160
-
161
-
162
-
163
-
164
-
165
-
166
-
167
-
168
-
169
-
170
-
171
-
172
-
173
-
174
-
175
-
176
-
177
-
178
-
179
-
180
-
181
-
182
-
183
-
184
-
185
-
186
-
187
-
188
-
189
-
190
-
191
-
192
-
193
-
194
-
195
-
196
-
197
-
198
-
199
-
200
-
201
-
202
-
203
-
204
-
205
-
206
-
207
-
208
-
209
-
210
-
211
-
212
-
213
-
214
-
215
-
216
-
217
-
218
-
219
-
220
-
221
-
222
-
223
-
224
-
225
-
226
-
227
-
228
-
229
-
230
-
231
-
232
-
233
-
234
-
235
-
236
-
237
-
238
 |
 |

Table of Contents
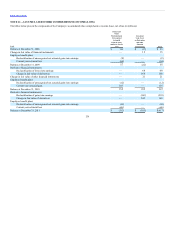
The tables below present disclosures about the activity for “Level Three” financial assets and financial liabilities for the twelve months ended December 31 (in
millions):
Balance at January 1 $119 $66 $ — $51
Acquired in Merger — — 117 —
Settlements (10) (4) — (4)
Gains reported in earnings 3 — — —
Reported in other comprehensive income (loss) 1 (2) 2 19
Balance at December 31 $113 $ 60 $119 $66
(a) For 2010 and 2011, United’s only Level Three recurring measurements are the above enhanced equipment trust certificate (“EETC”) securities.
As of December 31, 2011, Continental’s auction rate securities, which had a par value of $135 million and an amortized cost basis of $110 million, were
variable-rate debt instruments with contractual maturities generally greater than ten years and with interest rates that reset every 7, 28 or 35 days, depending
on the terms of the particular instrument. These securities are backed by pools of student loans guaranteed by state-designated guaranty agencies and reinsured
by the U.S. government. All of the auction rate securities that Continental holds are senior obligations under the applicable indentures authorizing the issuance
of the securities.
As of December 31, 2011, United’s EETC, which were repurchased in open market transactions in 2007, have an amortized cost basis of $66 million and
unrealized losses of $6 million. All changes in the fair value of these investments have been classified within accumulated other comprehensive income.
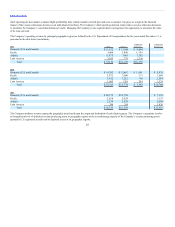
Balance at beginning of period $119 $286 $(164) $201 $20 $ — $ —
Merger impact — — — — — 520 (230)
Purchases, sales, issuances and settlements (net) (10) — — (106) — (263) 89
Gains and (losses):
Reported in earnings:
Realized 1 — — 23 (21) 47 (36)
Unrealized 2 (93) 69 — 1 (18) 13
Reported in other comprehensive income 1 — — 1 — — —
Balance at end of period $113 $ 193 $(95) $119 $ — $286 $(164)
(a) For 2010, amounts represent combined Continental Successor and Predecessor.
During the first nine months of 2010, Continental sold, at par, auction rate securities having a par value of $106 million. For certain of these auction rate
securities, Continental was granted a put right by an institution permitting Continental to sell to the institution at their full par value certain auction rate
securities. Continental classified the auction rate securities with the underlying put right as trading securities and elected the fair value
128