United Airlines 2011 Annual Report Download - page 106
Download and view the complete annual report
Please find page 106 of the 2011 United Airlines annual report below. You can navigate through the pages in the report by either clicking on the pages listed below, or by using the keyword search tool below to find specific information within the annual report.-
 1
1 -
2
-
3
-
4
-
5
-
6
-
7
-
8
-
9
-
10
-
11
-
12
-
13
-
14
-
15
-
16
-
17
-
18
-
19
-
20
-
21
-
22
-
23
-
24
-
25
-
26
-
27
-
28
-
29
-
30
-
31
-
32
-
33
-
34
-
35
-
36
-
37
-
38
-
39
-
40
-
41
-
42
-
43
-
44
-
45
-
46
-
47
-
48
-
49
-
50
-
51
-
52
-
53
-
54
-
55
-
56
-
57
-
58
-
59
-
60
-
61
-
62
-
63
-
64
-
65
-
66
-
67
-
68
-
69
-
70
-
71
-
72
-
73
-
74
-
75
-
76
-
77
-
78
-
79
-
80
-
81
-
82
-
83
-
84
-
85
-
86
-
87
-
88
-
89
-
90
-
91
-
92
-
93
-
94
-
95
-
 96
96 -
 97
97 -
 98
98 -
 99
99 -
 100
100 -
 101
101 -
 102
102 -
 103
103 -
 104
104 -
 105
105 -
 106
106 -
 107
107 -
 108
108 -
 109
109 -
 110
110 -
 111
111 -
 112
112 -
 113
113 -
 114
114 -
 115
115 -
 116
116 -
117
-
118
-
119
-
120
-
121
-
122
-
123
-
124
-
125
-
126
-
127
-
128
-
129
-
130
-
131
-
132
-
133
-
134
-
135
-
136
-
137
-
138
-
139
-
140
-
141
-
142
-
143
-
144
-
145
-
146
-
147
-
148
-
149
-
150
-
151
-
152
-
153
-
154
-
155
-
156
-
157
-
158
-
159
-
160
-
161
-
162
-
163
-
164
-
165
-
166
-
167
-
168
-
169
-
170
-
171
-
172
-
173
-
174
-
175
-
176
-
177
-
178
-
179
-
180
-
181
-
182
-
183
-
184
-
185
-
186
-
187
-
188
-
189
-
190
-
191
-
192
-
193
-
194
-
195
-
196
-
197
-
198
-
199
-
200
-
201
-
202
-
203
-
204
-
205
-
206
-
207
-
208
-
209
-
210
-
211
-
212
-
213
-
214
-
215
-
216
-
217
-
218
-
219
-
220
-
221
-
222
-
223
-
224
-
225
-
226
-
227
-
228
-
229
-
230
-
231
-
232
-
233
-
234
-
235
-
236
-
237
-
238
 |
 |

Table of Contents
would have been antidilutive. In addition, approximately 14 million potential shares of Continental common stock related to Continental’s convertible debt
securities were excluded from the computation of diluted loss per share for the year ended December 31, 2009 because they were antidilutive.
Prior to the Merger, UAL and Continental maintained separate share-based compensation plans. These plans provide for grants of qualified and non-qualified
stock options, stock appreciation rights, restricted stock awards, restricted stock units (“RSUs”), performance compensation awards, performance units,
cash incentive awards and other types of equity-based and equity-related awards. As part of the Merger, UAL assumed all of Continental’s outstanding share-
based compensation plans.
Following the Merger, UAL is now the sole issuer of all share-based compensation awards. All awards are recorded as equity or a liability in UAL’s
consolidated balance sheet. The share-based compensation expense specifically attributable to the employees of United and Continental is directly recorded to
salaries and related costs, or integration-related expense, within each of their respective statements of operations. United and Continental record an allocation of
share-based expense for employees that devote a significant amount of time to both companies. As United and Continental do not sponsor their own share-
based compensation plans, the disclosures below primarily relate to UAL. See the “Continental Predecessor” section below, for share-based compensation
disclosures applicable to Continental prior to the Merger.
In February 2011, UAL granted share-based compensation awards pursuant to the United Continental Holdings, Inc. 2008 Incentive Compensation Plan.
These share-based compensation awards include approximately 0.5 million shares of restricted stock that vest pro-rata over three years on the anniversary of
the grant date. These awards also include approximately 3.0 million performance-based RSUs consisting of approximately 1.2 million RSUs that vest based
on UAL’s return on invested capital for the period beginning January 1, 2011 and ending December 31, 2013, and 1.8 million RSUs that vest based on the
achievement of Merger-related goals. Vesting of a portion of the Merger incentive RSUs is based on the achievement of certain Merger-related milestones and
vesting of the remainder of the Merger incentive RSUs is based on the achievement of revenue and cost synergies over a three-year performance period ending
December 31, 2013. If the specified performance conditions are achieved, cash payments will be made shortly after the end of the performance period or
achievement of the specified Merger milestone, as applicable, based on the 20-day average closing price of UAL common stock either immediately prior to the
vesting date or, as applicable, on the last day of the month in which the Merger milestone is achieved. The Company accounts for the performance-based
RSUs as liability awards.
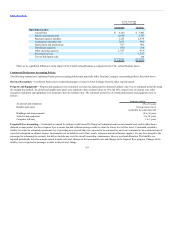
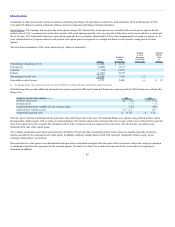
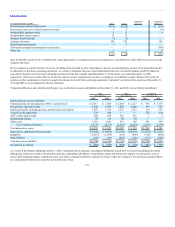
The following table provides information related to UAL share-based compensation plan cost, for the years ended December 31, (in millions):
Compensation cost: (a), (b)
Share-based awards converted to cash awards (c) $19 $84 $—
Restricted stock units 18 20 10
Restricted stock 12 6 6
Stock options 5 7 5
Total $ 54 $117 $ 21
(a) All compensation cost is recorded to Salaries and related benefits, with the exception of $17 million and $70 million in 2011 and 2010, respectively, that was recorded in integration and Merger-related costs,
respectively.
(b) United recorded $28 million and $63 million of compensation cost related to UAL’s share-based plans during 2011 and 2010, respectively. These amounts included $7 million and $24 million that were classified
as integration and Merger-related expense during
105