United Airlines 2011 Annual Report Download - page 120
Download and view the complete annual report
Please find page 120 of the 2011 United Airlines annual report below. You can navigate through the pages in the report by either clicking on the pages listed below, or by using the keyword search tool below to find specific information within the annual report.-
 1
1 -
2
-
3
-
4
-
5
-
6
-
7
-
8
-
9
-
10
-
11
-
12
-
13
-
14
-
15
-
16
-
17
-
18
-
19
-
20
-
21
-
22
-
23
-
24
-
25
-
26
-
27
-
28
-
29
-
30
-
31
-
32
-
33
-
34
-
35
-
36
-
37
-
38
-
39
-
40
-
41
-
42
-
43
-
44
-
45
-
46
-
47
-
48
-
49
-
50
-
51
-
52
-
53
-
54
-
55
-
56
-
57
-
58
-
59
-
60
-
61
-
62
-
63
-
64
-
65
-
66
-
67
-
68
-
69
-
70
-
71
-
72
-
73
-
74
-
75
-
76
-
77
-
78
-
79
-
80
-
81
-
82
-
83
-
84
-
85
-
86
-
87
-
88
-
89
-
90
-
91
-
92
-
93
-
94
-
95
-
96
-
97
-
98
-
99
-
100
-
101
-
102
-
103
-
104
-
105
-
106
-
107
-
108
-
109
-
 110
110 -
 111
111 -
 112
112 -
 113
113 -
 114
114 -
 115
115 -
 116
116 -
 117
117 -
 118
118 -
 119
119 -
 120
120 -
 121
121 -
 122
122 -
 123
123 -
 124
124 -
 125
125 -
 126
126 -
 127
127 -
 128
128 -
 129
129 -
 130
130 -
131
-
132
-
133
-
134
-
135
-
136
-
137
-
138
-
139
-
140
-
141
-
142
-
143
-
144
-
145
-
146
-
147
-
148
-
149
-
150
-
151
-
152
-
153
-
154
-
155
-
156
-
157
-
158
-
159
-
160
-
161
-
162
-
163
-
164
-
165
-
166
-
167
-
168
-
169
-
170
-
171
-
172
-
173
-
174
-
175
-
176
-
177
-
178
-
179
-
180
-
181
-
182
-
183
-
184
-
185
-
186
-
187
-
188
-
189
-
190
-
191
-
192
-
193
-
194
-
195
-
196
-
197
-
198
-
199
-
200
-
201
-
202
-
203
-
204
-
205
-
206
-
207
-
208
-
209
-
210
-
211
-
212
-
213
-
214
-
215
-
216
-
217
-
218
-
219
-
220
-
221
-
222
-
223
-
224
-
225
-
226
-
227
-
228
-
229
-
230
-
231
-
232
-
233
-
234
-
235
-
236
-
237
-
238
 |
 |

Table of Contents
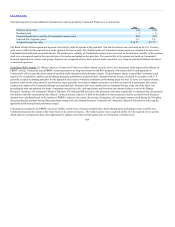
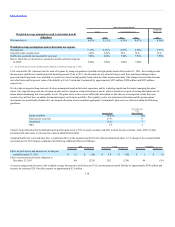
Fair Value Information. Accounting standards require us to use valuation techniques to measure fair value that maximize the use of observable inputs and
minimize the use of unobservable inputs. These inputs are prioritized as follows:
Level 1 Unadjusted quoted prices in active markets for assets or liabilities identical to those to be reported at fair value
Level 2 Other inputs that are observable directly or indirectly, such as quoted prices for similar assets or liabilities or market-corroborated inputs
Level 3
Unobservable inputs for which there is little or no market data and which require us to develop our own assumptions about how market
participants would price the assets or liabilities
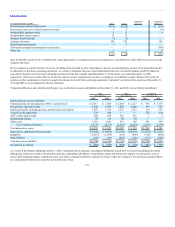
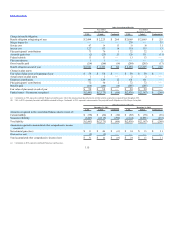
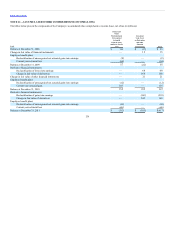
The following tables present information about the Company’s pension and other postretirement plan assets at December 31, (in millions):
Pension Plan Assets:
Equity securities funds $ 872 $355 $517 $ — $1,310 $— $1,310 $ —
Fixed-income securities 530 — 530 — 365 — 365 —
Alternatives 344 — 195 149 150 — — 150
Insurance contract 42 — — 42 42 — — 42
Other investments 80 — 80 — 4 — 4 —
Total $1,868 $355 $1,322 $191 $1,871 $— $1,679 $192
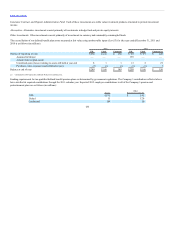
Other Postretirement Benefit Plan Assets:
Deposit administration fund $58 $ — $ — $58 $58 $— $ — $58
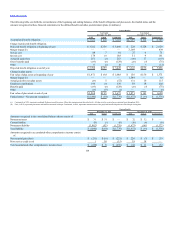
Pension Plan Assets:
Equity securities funds $102 $— $102 $— $113 $— $113 $—
Fixed-income securities 47 — 47 — 24 — 24 —
Insurance contract 42 — — 42 42 — — 42
Other investments 4 — 4 — 4 — 4 —
Total $195 $— $153 $42 $183 $— $141 $42
Other Postretirement Benefit Plan Assets:
Deposit administration fund $58 $— $— $58 $58 $— $— $58
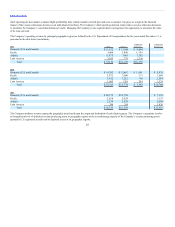
Pension Plan Assets:
Equity securities funds $770 $355 $ 415 $— $1,197 $— $1,197 $—
Fixed-income securities 483 — 483 — 341 — 341 —
Alternatives 344 — 195 149 150 — — 150
Other investments 76 — 76 — — — — —
Total $1,673 $355 $1,169 $149 $1,688 $— $1,538 $150
Equity securities include investments in both developed market and emerging market equity securities. Fixed-income
securities include primarily U.S. and non-U.S. government fixed-income securities and U.S. and non-U.S corporate fixed-income securities along with asset-
backed securities.
119