United Airlines 2011 Annual Report Download - page 157
Download and view the complete annual report
Please find page 157 of the 2011 United Airlines annual report below. You can navigate through the pages in the report by either clicking on the pages listed below, or by using the keyword search tool below to find specific information within the annual report.-
 1
1 -
2
-
3
-
4
-
5
-
6
-
7
-
8
-
9
-
10
-
11
-
12
-
13
-
14
-
15
-
16
-
17
-
18
-
19
-
20
-
21
-
22
-
23
-
24
-
25
-
26
-
27
-
28
-
29
-
30
-
31
-
32
-
33
-
34
-
35
-
36
-
37
-
38
-
39
-
40
-
41
-
42
-
43
-
44
-
45
-
46
-
47
-
48
-
49
-
50
-
51
-
52
-
53
-
54
-
55
-
56
-
57
-
58
-
59
-
60
-
61
-
62
-
63
-
64
-
65
-
66
-
67
-
68
-
69
-
70
-
71
-
72
-
73
-
74
-
75
-
76
-
77
-
78
-
79
-
80
-
81
-
82
-
83
-
84
-
85
-
86
-
87
-
88
-
89
-
90
-
91
-
92
-
93
-
94
-
95
-
96
-
97
-
98
-
99
-
100
-
101
-
102
-
103
-
104
-
105
-
106
-
107
-
108
-
109
-
110
-
111
-
112
-
113
-
114
-
115
-
116
-
117
-
118
-
119
-
120
-
121
-
122
-
123
-
124
-
125
-
126
-
127
-
128
-
129
-
130
-
131
-
132
-
133
-
134
-
135
-
136
-
137
-
138
-
139
-
140
-
141
-
142
-
143
-
144
-
145
-
146
-
 147
147 -
 148
148 -
 149
149 -
 150
150 -
 151
151 -
 152
152 -
 153
153 -
 154
154 -
 155
155 -
 156
156 -
 157
157 -
 158
158 -
 159
159 -
 160
160 -
 161
161 -
 162
162 -
 163
163 -
 164
164 -
 165
165 -
 166
166 -
 167
167 -
168
-
169
-
170
-
171
-
172
-
173
-
174
-
175
-
176
-
177
-
178
-
179
-
180
-
181
-
182
-
183
-
184
-
185
-
186
-
187
-
188
-
189
-
190
-
191
-
192
-
193
-
194
-
195
-
196
-
197
-
198
-
199
-
200
-
201
-
202
-
203
-
204
-
205
-
206
-
207
-
208
-
209
-
210
-
211
-
212
-
213
-
214
-
215
-
216
-
217
-
218
-
219
-
220
-
221
-
222
-
223
-
224
-
225
-
226
-
227
-
228
-
229
-
230
-
231
-
232
-
233
-
234
-
235
-
236
-
237
-
238
 |
 |

Table of Contents
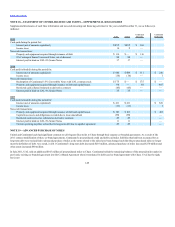
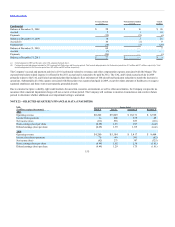
UAL’s quarterly financial data is subject to seasonal fluctuations and historically its second and third quarter financial results, which reflect higher travel
demand, are better than its first and fourth quarter financial results. UAL’s quarterly results were impacted by the following significant items (in millions):
Operating earnings:
Revenue—Co-brand Agreement modification (Note 2(c)) $ — $107 $ — $ —
Integration-related costs 79 145 123 170
Termination of maintenance service contract — — — 58
Aircraft-related charges (gains), net (2) 1 (3) (2)
Intangible asset impairment — — — 4
Other special items — — — 19
Total integration-related costs and special items $ 77 $ 146 $120 $ 249
Total special items, net in operating income $ 77 $ 39 $120 $ 249
Operating earnings:
Merger-related costs $ — $ 28 $44 $493
Asset impairments 17 73 22 53
Other special items 1 5 (3) —
Goodwill impairment credit — — — (64)
Total Merger-related costs and special charges in operating income (loss) $ 18 $ 106 $ 63 $482
Non-cash fuel hedge mark-to-market (gains) losses $(31) $37 $ 12 $14
See Note 21 for further discussion of these items.
156