United Airlines 2011 Annual Report Download - page 48
Download and view the complete annual report
Please find page 48 of the 2011 United Airlines annual report below. You can navigate through the pages in the report by either clicking on the pages listed below, or by using the keyword search tool below to find specific information within the annual report.-
 1
1 -
2
-
3
-
4
-
5
-
6
-
7
-
8
-
9
-
10
-
11
-
12
-
13
-
14
-
15
-
16
-
17
-
18
-
19
-
20
-
21
-
22
-
23
-
24
-
25
-
26
-
27
-
28
-
29
-
30
-
31
-
32
-
33
-
34
-
35
-
36
-
37
-
 38
38 -
 39
39 -
 40
40 -
 41
41 -
 42
42 -
 43
43 -
 44
44 -
 45
45 -
 46
46 -
 47
47 -
 48
48 -
 49
49 -
 50
50 -
 51
51 -
 52
52 -
 53
53 -
 54
54 -
 55
55 -
 56
56 -
 57
57 -
 58
58 -
59
-
60
-
61
-
62
-
63
-
64
-
65
-
66
-
67
-
68
-
69
-
70
-
71
-
72
-
73
-
74
-
75
-
76
-
77
-
78
-
79
-
80
-
81
-
82
-
83
-
84
-
85
-
86
-
87
-
88
-
89
-
90
-
91
-
92
-
93
-
94
-
95
-
96
-
97
-
98
-
99
-
100
-
101
-
102
-
103
-
104
-
105
-
106
-
107
-
108
-
109
-
110
-
111
-
112
-
113
-
114
-
115
-
116
-
117
-
118
-
119
-
120
-
121
-
122
-
123
-
124
-
125
-
126
-
127
-
128
-
129
-
130
-
131
-
132
-
133
-
134
-
135
-
136
-
137
-
138
-
139
-
140
-
141
-
142
-
143
-
144
-
145
-
146
-
147
-
148
-
149
-
150
-
151
-
152
-
153
-
154
-
155
-
156
-
157
-
158
-
159
-
160
-
161
-
162
-
163
-
164
-
165
-
166
-
167
-
168
-
169
-
170
-
171
-
172
-
173
-
174
-
175
-
176
-
177
-
178
-
179
-
180
-
181
-
182
-
183
-
184
-
185
-
186
-
187
-
188
-
189
-
190
-
191
-
192
-
193
-
194
-
195
-
196
-
197
-
198
-
199
-
200
-
201
-
202
-
203
-
204
-
205
-
206
-
207
-
208
-
209
-
210
-
211
-
212
-
213
-
214
-
215
-
216
-
217
-
218
-
219
-
220
-
221
-
222
-
223
-
224
-
225
-
226
-
227
-
228
-
229
-
230
-
231
-
232
-
233
-
234
-
235
-
236
-
237
-
238
 |
 |

Table of Contents
Continental
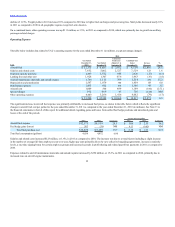
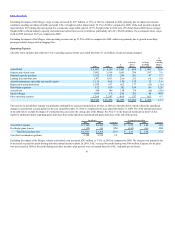
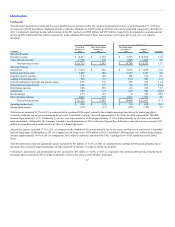
The table below presents the Continental Successor and Predecessor periods in 2010. The combined presentation for the year ended December 31, 2010 does
not represent a GAAP presentation. Management believes that the combined non-GAAP results for 2010 provide a more meaningful comparison to the full year
2011. Continental’s operating income and net income in the 2011 period were $950 million and $569 million, respectively, as compared to operating and net
income of $698 million and $346 million, respectively, in the combined 2010 period. These improvements were largely due to year-over-year capacity
discipline.
Operating Revenue:
Passenger revenue $14,417 $3,165 $9,503 $12,668 13.8
Cargo and other revenue 1,758 398 1,285 1,683 4.5
Total operating revenue $16,175 $3,563 $ 10,788 $ 14,351 12.7
Operating Expense:
Aircraft fuel $5,294 $986 $2,872 $3,858 37.2
Salaries and related costs 3,405 786 2,527 3,313 2.8
Regional capacity purchase 830 202 608 810 2.5
Landing fees and other rent 900 231 656 887 1.5
Aircraft maintenance materials and outside repairs 595 135 399 534 11.4
Depreciation and amortization 626 177 380 557 12.4
Distribution expenses 688 156 474 630 9.2
Aircraft rent 686 174 689 863 (20.5)
Special charges 159 201 47 248 NM
Other operating expenses 2,042 537 1,416 1,953 4.6
Total operating expense $15,225 $3,585 $ 10,068 $13,653 11.5
Operating income (loss) $950 $(22) $720 $698 36.1
Nonoperating expense (387) (77) (278) (355) 9.0
Total revenues increased 12.7% in 2011 as compared to the combined 2010 period, primarily due to higher passenger fares driven by improving global
economic conditions and an increased demand for air travel. Continental’s capacity increased approximately 1.9% while its traffic remained flat. PRASM
increased approximately 11.7%. Continental’s year-over-year improvement in Yield of approximately 13.1% is driven primarily by increases in its domestic
and Latin markets. Additionally, the Company recorded a special adjustment in 2011 to decrease frequent flyer deferred revenue and increase revenue by $19
million in connection with a modification to its Chase Co-Brand Agreement.
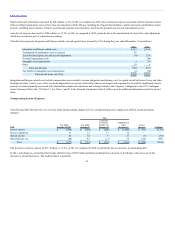
Aircraft fuel expense increased 37.2% in 2011 as compared to the combined 2010 period, primarily due to an increase in the prices of aircraft fuel. Continental
had fuel hedge gains of $86 million in 2011 as compared to fuel hedge losses of $9 million in 2010. Continental’s fuel purchase cost, without hedge impacts,
increased approximately 39.8% in 2011 as compared to 2010, which is relatively consistent with UAL’s unhedged cost of fuel summarized in the tables
above.
Aircraft maintenance materials and outside repairs increased by $61 million, or 11.4%, in 2011 as compared to the combined 2010 period, primarily due to
increased rates on aircraft engine maintenance and the expiration of warranty coverage on certain aircraft parts.
Continental’s depreciation and amortization expense increased by $69 million, or 12.4%, in 2011 as compared to the combined 2010 period, primarily due to
increased expense associated with recording Continental’s assets at fair value as of the Merger closing date.
47