United Airlines 2011 Annual Report Download - page 133
Download and view the complete annual report
Please find page 133 of the 2011 United Airlines annual report below. You can navigate through the pages in the report by either clicking on the pages listed below, or by using the keyword search tool below to find specific information within the annual report.-
 1
1 -
2
-
3
-
4
-
5
-
6
-
7
-
8
-
9
-
10
-
11
-
12
-
13
-
14
-
15
-
16
-
17
-
18
-
19
-
20
-
21
-
22
-
23
-
24
-
25
-
26
-
27
-
28
-
29
-
30
-
31
-
32
-
33
-
34
-
35
-
36
-
37
-
38
-
39
-
40
-
41
-
42
-
43
-
44
-
45
-
46
-
47
-
48
-
49
-
50
-
51
-
52
-
53
-
54
-
55
-
56
-
57
-
58
-
59
-
60
-
61
-
62
-
63
-
64
-
65
-
66
-
67
-
68
-
69
-
70
-
71
-
72
-
73
-
74
-
75
-
76
-
77
-
78
-
79
-
80
-
81
-
82
-
83
-
84
-
85
-
86
-
87
-
88
-
89
-
90
-
91
-
92
-
93
-
94
-
95
-
96
-
97
-
98
-
99
-
100
-
101
-
102
-
103
-
104
-
105
-
106
-
107
-
108
-
109
-
110
-
111
-
112
-
113
-
114
-
115
-
116
-
117
-
118
-
119
-
120
-
121
-
122
-
 123
123 -
 124
124 -
 125
125 -
 126
126 -
 127
127 -
 128
128 -
 129
129 -
 130
130 -
 131
131 -
 132
132 -
 133
133 -
 134
134 -
 135
135 -
 136
136 -
 137
137 -
 138
138 -
 139
139 -
 140
140 -
 141
141 -
 142
142 -
 143
143 -
144
-
145
-
146
-
147
-
148
-
149
-
150
-
151
-
152
-
153
-
154
-
155
-
156
-
157
-
158
-
159
-
160
-
161
-
162
-
163
-
164
-
165
-
166
-
167
-
168
-
169
-
170
-
171
-
172
-
173
-
174
-
175
-
176
-
177
-
178
-
179
-
180
-
181
-
182
-
183
-
184
-
185
-
186
-
187
-
188
-
189
-
190
-
191
-
192
-
193
-
194
-
195
-
196
-
197
-
198
-
199
-
200
-
201
-
202
-
203
-
204
-
205
-
206
-
207
-
208
-
209
-
210
-
211
-
212
-
213
-
214
-
215
-
216
-
217
-
218
-
219
-
220
-
221
-
222
-
223
-
224
-
225
-
226
-
227
-
228
-
229
-
230
-
231
-
232
-
233
-
234
-
235
-
236
-
237
-
238
 |
 |

Table of Contents
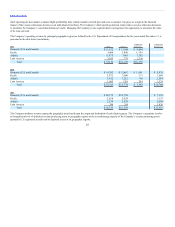
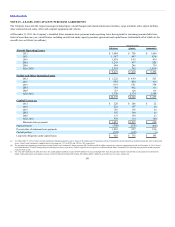
presents the fair value amounts of fuel derivative assets and liabilities and the location of amounts recognized in the Company’s financial statements. As of
December 31, 2011 and December 31, 2010, all of the Company’s fuel derivatives were designated as cash flow hedges.
At December 31, the Company’s derivatives were reported in its consolidated balance sheets as follows (in millions):
Fuel contracts due within one year Receivables $77 $48 $29 $375 $277 $98
Fuel contracts due within one year
Other current
liabilities $4 $4 $ — $— $— $ —
The following tables present the fuel hedge gains (losses) recognized during the periods presented and their classification in the financial statements (in
millions):
UAL $ 163 $170 $503 $(70) $(59) $10
United 172 101 417 (84) (21) 8
Continental—Successor (9) 69 86 14 (38) 2
Continental—Predecessor N/A (4) N/A (23) N/A (2)
UAL/United $ — $(35) $104 $— $— $31 $— $(35) $135
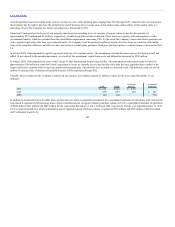
Derivative Credit Risk and Fair Value
The Company is exposed to credit losses in the event of nonperformance by counterparties to its derivative instruments. While the Company records derivative
instruments on a gross basis, the Company monitors its net derivative position with each counterparty to monitor credit risk. Based on the fair value of our
fuel derivative instruments, our counterparties may require us to post collateral when the price of the underlying commodity decreases, and we may require our
counterparties to provide us with collateral when the price of the underlying commodity increases. The following table presents information related to the
Company’s derivative credit risk as of December 31, (in millions):
Net derivative assets with counterparties $73 $44 $29 $375 $277 $98
Collateral held by the Company (a) — — — 63 63 —
Potential loss related to the failure of the Company’s counterparties to perform $73 $44 $29 $312 $214 $98
(a) Classified as an other current liability.
132