United Airlines 2011 Annual Report Download - page 156
Download and view the complete annual report
Please find page 156 of the 2011 United Airlines annual report below. You can navigate through the pages in the report by either clicking on the pages listed below, or by using the keyword search tool below to find specific information within the annual report.-
 1
1 -
2
-
3
-
4
-
5
-
6
-
7
-
8
-
9
-
10
-
11
-
12
-
13
-
14
-
15
-
16
-
17
-
18
-
19
-
20
-
21
-
22
-
23
-
24
-
25
-
26
-
27
-
28
-
29
-
30
-
31
-
32
-
33
-
34
-
35
-
36
-
37
-
38
-
39
-
40
-
41
-
42
-
43
-
44
-
45
-
46
-
47
-
48
-
49
-
50
-
51
-
52
-
53
-
54
-
55
-
56
-
57
-
58
-
59
-
60
-
61
-
62
-
63
-
64
-
65
-
66
-
67
-
68
-
69
-
70
-
71
-
72
-
73
-
74
-
75
-
76
-
77
-
78
-
79
-
80
-
81
-
82
-
83
-
84
-
85
-
86
-
87
-
88
-
89
-
90
-
91
-
92
-
93
-
94
-
95
-
96
-
97
-
98
-
99
-
100
-
101
-
102
-
103
-
104
-
105
-
106
-
107
-
108
-
109
-
110
-
111
-
112
-
113
-
114
-
115
-
116
-
117
-
118
-
119
-
120
-
121
-
122
-
123
-
124
-
125
-
126
-
127
-
128
-
129
-
130
-
131
-
132
-
133
-
134
-
135
-
136
-
137
-
138
-
139
-
140
-
141
-
142
-
143
-
144
-
145
-
 146
146 -
 147
147 -
 148
148 -
 149
149 -
 150
150 -
 151
151 -
 152
152 -
 153
153 -
 154
154 -
 155
155 -
 156
156 -
 157
157 -
 158
158 -
 159
159 -
 160
160 -
 161
161 -
 162
162 -
 163
163 -
 164
164 -
 165
165 -
 166
166 -
167
-
168
-
169
-
170
-
171
-
172
-
173
-
174
-
175
-
176
-
177
-
178
-
179
-
180
-
181
-
182
-
183
-
184
-
185
-
186
-
187
-
188
-
189
-
190
-
191
-
192
-
193
-
194
-
195
-
196
-
197
-
198
-
199
-
200
-
201
-
202
-
203
-
204
-
205
-
206
-
207
-
208
-
209
-
210
-
211
-
212
-
213
-
214
-
215
-
216
-
217
-
218
-
219
-
220
-
221
-
222
-
223
-
224
-
225
-
226
-
227
-
228
-
229
-
230
-
231
-
232
-
233
-
234
-
235
-
236
-
237
-
238
 |
 |

Table of Contents
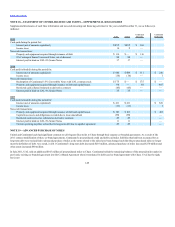
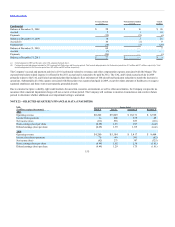
Balance at December 31, 2008 $ 28 $10 $20
Accrual 5 1 10
Payments (19) (9) (4)
Balance at December 31, 2009 14 2 26
Accrual (b) 84 (1) 9
Payments (b) (38) (1) (28)
Balance at December 31, 2010 60 — 7
Accrual (7) — —
Payments (26) — (3)
Balance at December 31, 2011 $ 27 $ — $4
(a) United amounts for 2009 are the same as the UAL amounts disclosed above.
(b) Continental accrual and payment amounts for 2010 represent both Predecessor and Successor periods. Total accrual and payments in the Predecessor period were $11 million and $17 million, respectively. Total
accrual and payments in the Successor period were $81 million and $50 million, respectively.
The Company’s accrual and payment activity in 2011 is primarily related to severance and other compensation expense associated with the Merger. The
expected total salary-related expense is reflected in the 2011 accrual and is expected to be paid by 2012. The UAL and United accrual activity in 2009
primarily relates to the UAL and United operational plans that included a fleet retirement of 100 aircraft and headcount reduction to match the decrease in
operations. Substantially all of the expense associated with these plans was expensed and paid in 2009, except for minor amounts of healthcare coverage to
separated employees and future rent on permanently grounded aircraft.
Due to extreme fuel price volatility, tight credit markets, the uncertain economic environment, as well as other uncertainties, the Company can provide no
assurance that a material impairment charge will not occur in a future period. The Company will continue to monitor circumstances and events in future
periods to determine whether additional asset impairment testing is warranted.
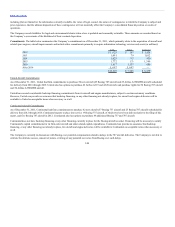
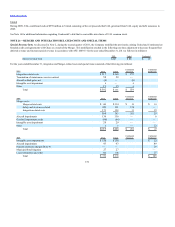
Operating revenue $8,202 $9,809 $ 10,171 $8,928
Income from operations 34 808 935 45
Net income (loss) (213) 538 653 (138)
Basic earnings (loss) per share (0.65) 1.63 1.97 (0.42)
Diluted earnings (loss) per share (0.65) 1.39 1.69 (0.42)
Operating revenue $4,260 $5,184 $5,417 $ 8,464
Income (loss) from operations 76 441 541 (82)
Net income (loss) (82) 273 387 (325)
Basic earnings (loss) per share (0.49) 1.62 2.30 (1.01)
Diluted earnings (loss) per share (0.49) 1.29 1.75 (1.01)
155