United Airlines 2011 Annual Report Download - page 50
Download and view the complete annual report
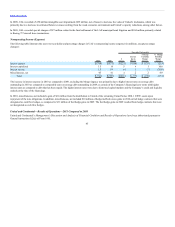
Please find page 50 of the 2011 United Airlines annual report below. You can navigate through the pages in the report by either clicking on the pages listed below, or by using the keyword search tool below to find specific information within the annual report.-
 1
1 -
2
-
3
-
4
-
5
-
6
-
7
-
8
-
9
-
10
-
11
-
12
-
13
-
14
-
15
-
16
-
17
-
18
-
19
-
20
-
21
-
22
-
23
-
24
-
25
-
26
-
27
-
28
-
29
-
30
-
31
-
32
-
33
-
34
-
35
-
36
-
37
-
38
-
39
-
 40
40 -
 41
41 -
 42
42 -
 43
43 -
 44
44 -
 45
45 -
 46
46 -
 47
47 -
 48
48 -
 49
49 -
 50
50 -
 51
51 -
 52
52 -
 53
53 -
 54
54 -
 55
55 -
 56
56 -
 57
57 -
 58
58 -
 59
59 -
 60
60 -
61
-
62
-
63
-
64
-
65
-
66
-
67
-
68
-
69
-
70
-
71
-
72
-
73
-
74
-
75
-
76
-
77
-
78
-
79
-
80
-
81
-
82
-
83
-
84
-
85
-
86
-
87
-
88
-
89
-
90
-
91
-
92
-
93
-
94
-
95
-
96
-
97
-
98
-
99
-
100
-
101
-
102
-
103
-
104
-
105
-
106
-
107
-
108
-
109
-
110
-
111
-
112
-
113
-
114
-
115
-
116
-
117
-
118
-
119
-
120
-
121
-
122
-
123
-
124
-
125
-
126
-
127
-
128
-
129
-
130
-
131
-
132
-
133
-
134
-
135
-
136
-
137
-
138
-
139
-
140
-
141
-
142
-
143
-
144
-
145
-
146
-
147
-
148
-
149
-
150
-
151
-
152
-
153
-
154
-
155
-
156
-
157
-
158
-
159
-
160
-
161
-
162
-
163
-
164
-
165
-
166
-
167
-
168
-
169
-
170
-
171
-
172
-
173
-
174
-
175
-
176
-
177
-
178
-
179
-
180
-
181
-
182
-
183
-
184
-
185
-
186
-
187
-
188
-
189
-
190
-
191
-
192
-
193
-
194
-
195
-
196
-
197
-
198
-
199
-
200
-
201
-
202
-
203
-
204
-
205
-
206
-
207
-
208
-
209
-
210
-
211
-
212
-
213
-
214
-
215
-
216
-
217
-
218
-
219
-
220
-
221
-
222
-
223
-
224
-
225
-
226
-
227
-
228
-
229
-
230
-
231
-
232
-
233
-
234
-
235
-
236
-
237
-
238
 |
 |

Table of Contents
the capital markets in the future on acceptable terms, or at all. We must sustain our profitability and/or access the capital markets to meet our significant long-
term debt and capital lease obligations and future commitments for capital expenditures, including the acquisition of aircraft and related spare engines.
The following is a discussion of UAL’s sources and uses of cash from 2009 to 2011. As UAL applied the acquisition method of accounting to the Merger,
UAL’s cash activities discussed below include Continental’s activities only after October 1, 2010.
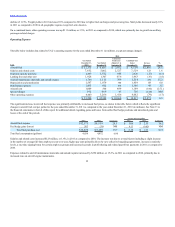
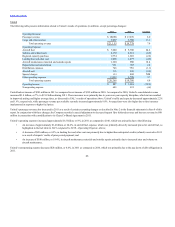
Cash Flows from Operating Activities
UAL’s cash from operating activities increased by $501 million in 2011, as compared to 2010. Cash from operations improved due to the Company’s
improved operational performance in 2011. The Company’s increased revenues were offset in part by higher cash operating expenses resulting from the
Merger, including fuel and aircraft maintenance expense.
UAL’s cash from operating activities increased by $941 million in 2010, as compared to 2009. This year-over-year increase was primarily due to increased
cash from passenger and cargo services. Higher cash operating expenses, including fuel, distribution costs and interest expense, partially offset the benefit
from increased revenues. Operating cash flows in the 2009 period included the receipt of $160 million related to the relocation of UAL’s O’Hare cargo facility.
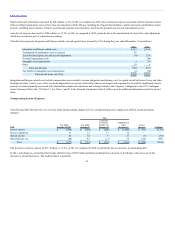
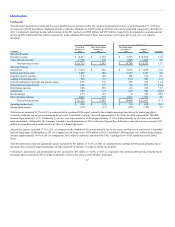
Cash Flows from Investing Activities
UAL’s capital expenditures were $700 million and $371 million in 2011 and 2010, respectively. Approximately half of the capital expenditures in 2011 related
to aircraft upgrades across the Company’s fleet for its international premium travel product as well as various facility and ground equipment projects. Some of
these capital expenditures relate to improvements to assets as a result of the Merger. Also, in 2011, the Company had purchased nine aircraft that were operated
under leases for $88 million and were immediately sold to third parties upon acquisition for proceeds of $72 million.
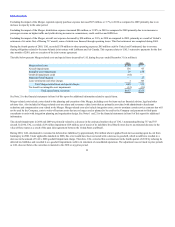
In December 2011, United cash collateralized $194 million of its letters of credit that had previously been issued and collateralized under the Amended Credit
Facility, resulting in an increase in restricted cash, as discussed in above.
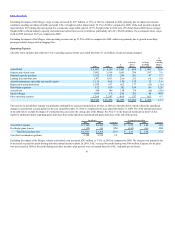
UAL increased its short-term investments, net of proceeds, by $898 million in 2011 as compared to 2010. This was primarily due to the placement of
additional funds with outside money managers and movement of liquid assets from cash to short-term investments. United’s short-term investments, net of
proceeds, increased by $269 million while Continental’s short-term investments, net of proceeds, increased by $629 million in 2011 as compared to 2010.
UAL’s capital expenditures were $371 million and $317 million in 2010 and 2009, respectively. Included in UAL’s 2010 capital expenditures are
Continental’s capital expenditures in the fourth quarter of 2010. In addition to cash capital expenditures, UAL’s asset additions include Continental’s
acquisition of three Boeing 737 aircraft in the fourth quarter of 2010. The proceeds of Continental’s EETC financing in the fourth quarter of 2010 (described
below) were directly issued to the aircraft manufacturers; therefore, these proceeds are not presented as capital expenditures and financing proceeds in the
statements of consolidated cash flows. UAL limited its spending in both 2010 and 2009 by focusing its capital resources only on its highest-value projects.
49