United Airlines 2011 Annual Report Download - page 45
Download and view the complete annual report
Please find page 45 of the 2011 United Airlines annual report below. You can navigate through the pages in the report by either clicking on the pages listed below, or by using the keyword search tool below to find specific information within the annual report.-
 1
1 -
2
-
3
-
4
-
5
-
6
-
7
-
8
-
9
-
10
-
11
-
12
-
13
-
14
-
15
-
16
-
17
-
18
-
19
-
20
-
21
-
22
-
23
-
24
-
25
-
26
-
27
-
28
-
29
-
30
-
31
-
32
-
33
-
34
-
 35
35 -
 36
36 -
 37
37 -
 38
38 -
 39
39 -
 40
40 -
 41
41 -
 42
42 -
 43
43 -
 44
44 -
 45
45 -
 46
46 -
 47
47 -
 48
48 -
 49
49 -
 50
50 -
 51
51 -
 52
52 -
 53
53 -
 54
54 -
 55
55 -
56
-
57
-
58
-
59
-
60
-
61
-
62
-
63
-
64
-
65
-
66
-
67
-
68
-
69
-
70
-
71
-
72
-
73
-
74
-
75
-
76
-
77
-
78
-
79
-
80
-
81
-
82
-
83
-
84
-
85
-
86
-
87
-
88
-
89
-
90
-
91
-
92
-
93
-
94
-
95
-
96
-
97
-
98
-
99
-
100
-
101
-
102
-
103
-
104
-
105
-
106
-
107
-
108
-
109
-
110
-
111
-
112
-
113
-
114
-
115
-
116
-
117
-
118
-
119
-
120
-
121
-
122
-
123
-
124
-
125
-
126
-
127
-
128
-
129
-
130
-
131
-
132
-
133
-
134
-
135
-
136
-
137
-
138
-
139
-
140
-
141
-
142
-
143
-
144
-
145
-
146
-
147
-
148
-
149
-
150
-
151
-
152
-
153
-
154
-
155
-
156
-
157
-
158
-
159
-
160
-
161
-
162
-
163
-
164
-
165
-
166
-
167
-
168
-
169
-
170
-
171
-
172
-
173
-
174
-
175
-
176
-
177
-
178
-
179
-
180
-
181
-
182
-
183
-
184
-
185
-
186
-
187
-
188
-
189
-
190
-
191
-
192
-
193
-
194
-
195
-
196
-
197
-
198
-
199
-
200
-
201
-
202
-
203
-
204
-
205
-
206
-
207
-
208
-
209
-
210
-
211
-
212
-
213
-
214
-
215
-
216
-
217
-
218
-
219
-
220
-
221
-
222
-
223
-
224
-
225
-
226
-
227
-
228
-
229
-
230
-
231
-
232
-
233
-
234
-
235
-
236
-
237
-
238
 |
 |

Table of Contents
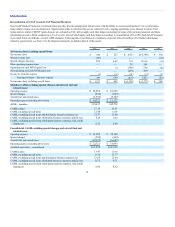
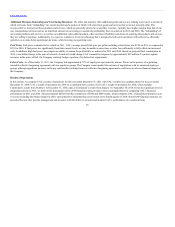
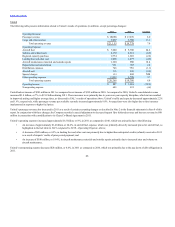
Excluding the impact of the Merger, regional capacity purchase expense increased $87 million, or 5.7%, in 2010 as compared to 2009 primarily due to an
increase in capacity in the same period.
Excluding the impact of the Merger, distribution expenses increased $86 million, or 12.8%, in 2010 as compared to 2009 primarily due to an increase in
passenger revenue on higher traffic and yields driving increases in commissions, credit card fees and GDS fees.
Excluding the impact of the Merger, aircraft rent expense decreased by $20 million, or 5.8%, in 2010 as compared to 2009, primarily as a result of United’s
retirement of its entire fleet of Boeing 737 aircraft, some of which were financed through operating leases. This fleet retirement was completed during 2009.
During the fourth quarter of 2010, UAL recorded $130 million to other operating expenses, $65 million each for United and Continental, due to revenue
sharing obligations related to the trans-Atlantic joint venture with Lufthansa and Air Canada. This expense relates to UAL’s retroactive payments for the first
nine months of 2010, prior to execution of the joint venture agreement.
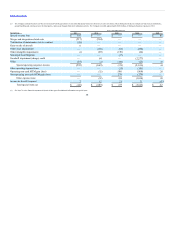
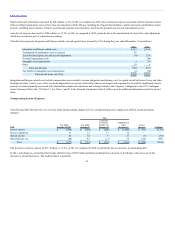
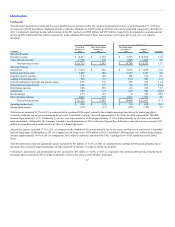
The table below presents Merger-related costs and special items incurred by UAL during the years ended December 31 (in millions):
Merger-related costs $564 $—
Aircraft impairments 136 93
Intangible asset impairments 29 150
Goodwill impairment credit (64) —
Municipal bond litigation — 27
Lease termination and other charges 4 104
Total Merger-related items and special charges 669 374
Tax benefit on intangible asset impairments (12) (21)
Total special items, net of tax $657 $353
See Note 21 to the financial statements in Item 8 of this report for additional information related to special items.
Merger-related costs include costs related to the planning and execution of the Merger, including costs for items such as financial advisor, legal and other
advisory fees. Also included in Merger-related costs are salary and severance related costs that are primarily associated with administrative headcount
reductions and compensation costs related to the Merger. Merger-related costs also include integration costs, costs to terminate certain service contracts that will
not be used by the Company, costs to write-off system assets that are no longer used or planned to be used by the Company and payments to third-party
consultants to assist with integration planning and organization design. See Notes 1 and 21 to the financial statements in Item 8 of this report for additional
information.
The aircraft impairments in 2010 and 2009 are primarily related to a decrease in the estimated market value of UAL’s nonoperating Boeing 737 and 747
aircraft. In 2010, UAL recorded a $29 million impairment ($18 million, net of taxes) of its indefinite-lived Brazil routes due to an estimated decrease in the
value of these routes as a result of the open skies agreement between the United States and Brazil.
During 2010, UAL determined it overstated its deferred tax liabilities by approximately $64 million when it applied fresh start accounting upon its exit from
bankruptcy in 2006. Under applicable standards in 2008, this error would have been corrected with a decrease to goodwill, which would have resulted in a
decrease in the amount of UAL’s 2008 goodwill impairment charge. Therefore, UAL corrected this overstatement in the fourth quarter of 2010 by reducing its
deferred tax liabilities and recorded it as a goodwill impairment credit in its statement of consolidated operations. The adjustment was not made to prior periods
as UAL does not believe the correction is material to the 2010 or any prior period.
44