United Airlines 2011 Annual Report Download - page 123
Download and view the complete annual report
Please find page 123 of the 2011 United Airlines annual report below. You can navigate through the pages in the report by either clicking on the pages listed below, or by using the keyword search tool below to find specific information within the annual report.-
 1
1 -
2
-
3
-
4
-
5
-
6
-
7
-
8
-
9
-
10
-
11
-
12
-
13
-
14
-
15
-
16
-
17
-
18
-
19
-
20
-
21
-
22
-
23
-
24
-
25
-
26
-
27
-
28
-
29
-
30
-
31
-
32
-
33
-
34
-
35
-
36
-
37
-
38
-
39
-
40
-
41
-
42
-
43
-
44
-
45
-
46
-
47
-
48
-
49
-
50
-
51
-
52
-
53
-
54
-
55
-
56
-
57
-
58
-
59
-
60
-
61
-
62
-
63
-
64
-
65
-
66
-
67
-
68
-
69
-
70
-
71
-
72
-
73
-
74
-
75
-
76
-
77
-
78
-
79
-
80
-
81
-
82
-
83
-
84
-
85
-
86
-
87
-
88
-
89
-
90
-
91
-
92
-
93
-
94
-
95
-
96
-
97
-
98
-
99
-
100
-
101
-
102
-
103
-
104
-
105
-
106
-
107
-
108
-
109
-
110
-
111
-
112
-
 113
113 -
 114
114 -
 115
115 -
 116
116 -
 117
117 -
 118
118 -
 119
119 -
 120
120 -
 121
121 -
 122
122 -
 123
123 -
 124
124 -
 125
125 -
 126
126 -
 127
127 -
 128
128 -
 129
129 -
 130
130 -
 131
131 -
 132
132 -
 133
133 -
134
-
135
-
136
-
137
-
138
-
139
-
140
-
141
-
142
-
143
-
144
-
145
-
146
-
147
-
148
-
149
-
150
-
151
-
152
-
153
-
154
-
155
-
156
-
157
-
158
-
159
-
160
-
161
-
162
-
163
-
164
-
165
-
166
-
167
-
168
-
169
-
170
-
171
-
172
-
173
-
174
-
175
-
176
-
177
-
178
-
179
-
180
-
181
-
182
-
183
-
184
-
185
-
186
-
187
-
188
-
189
-
190
-
191
-
192
-
193
-
194
-
195
-
196
-
197
-
198
-
199
-
200
-
201
-
202
-
203
-
204
-
205
-
206
-
207
-
208
-
209
-
210
-
211
-
212
-
213
-
214
-
215
-
216
-
217
-
218
-
219
-
220
-
221
-
222
-
223
-
224
-
225
-
226
-
227
-
228
-
229
-
230
-
231
-
232
-
233
-
234
-
235
-
236
-
237
-
238
 |
 |

Table of Contents
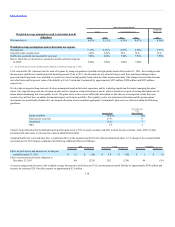
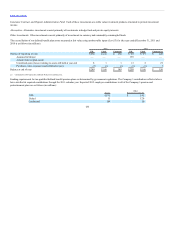
United’s participation in the IAM Plan for the annual period ended December 31, 2011, is outlined in the table below. There have been no significant changes
that affect the comparability of 2011 and 2010 contributions. The IAM Plan reported $332 million and $318 million in employers’ contributions for the years
ended December 31, 2010 and 2009 respectively; United’s contributions to the IAM Plan were $34 million for each of the years ended December 31, 2011,
2010 and 2009. For 2010 and 2009, the employer’s contribution to the Company’s plan represented more than 5% of total contributions.
Pension Fund IAM National Pension Fund
EIN/ Pension Plan Number 51-6031295 - 002
Pension Protection Act Zone Status (2010 and 2009)* Green Zone
FIP/RP Status Pending/Implemented No
United’s Contributions (Years ended December 31, 2011 and December 31,
2010) $34 million
Surcharge Imposed No
Expiration Date of Collective-Bargaining Agreement N/A
*Plans in the green zone are at least 80 percent funded.
At the date the financial statements were issued, Forms 5500 were not available for the plan year ending in 2011.
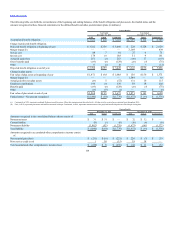
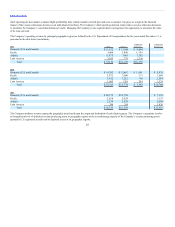
UAL, United and Continental recorded profit sharing and related payroll tax expense of $265 million, $122 million and $143 million, respectively, in 2011.
UAL, United, Continental Successor and Continental Predecessor recorded profit sharing and related payroll tax expense of $166 million, $165 million, less
than $1 million and $77 million, respectively, in 2010. Profit sharing expense is recorded as a component of salaries and related costs in the consolidated
statements of operations. The Company did not record profit sharing expense in 2009 due to pretax losses.
In 2011, substantially all employees participated in profit sharing plans, which paid 15% of total pre-tax earnings, excluding special items and share-based
compensation expense, to eligible employees when pre-tax profit, excluding special items, profit sharing expense and share-based compensation program
expense, exceeds $10 million. Eligible U.S. co-workers in each participating work group received a profit sharing payout using a formula based on the ratio of
each qualified co-worker’s annual eligible earnings to the eligible earnings of all qualified co-workers in all domestic workgroups. The international profit
sharing plan paid eligible non-U.S. co-workers the same percentage of eligible pay that is calculated under the U.S. profit sharing plan.
During 2010, United and Continental maintained separate employee profit sharing plans for the employees of each respective subsidiary. United’s profit
sharing plan paid 15% of total GAAP pre-tax profits, excluding special items and share-based compensation expense, to the employees of United when pre-tax
profit excluding special items, profit sharing expense and share-based compensation program expense exceeded $10 million. Continental’s profit sharing plan
created an award pool of 15% of annual pre-tax income excluding special, unusual or non-recurring items.
Operating segments are defined as components of an enterprise with separate financial information, which are evaluated regularly by the chief operating
decision maker and are used in resource allocation and performance assessments. Prior to the Merger, the Company managed its business by two reporting
segments: Mainline and Regional. In connection with the Merger integration and design of the new organization, the new management determined that the
Company will be managed as one segment, airline operations, because the Company’s services are passenger and cargo air transportation. The Company has
retrospectively applied its new segment reporting.
The Company has multiple aircraft fleets which are deployed across its route network through a single route scheduling system to maximize the value of UAL.
When making resource allocation decisions, the Company’s
122