United Airlines 2011 Annual Report Download - page 66
Download and view the complete annual report
Please find page 66 of the 2011 United Airlines annual report below. You can navigate through the pages in the report by either clicking on the pages listed below, or by using the keyword search tool below to find specific information within the annual report.
Table of Contents
To protect against increases in the prices of aircraft fuel, the Company routinely hedges a portion of its future fuel requirements. The Company uses fixed
price swaps, purchased call options, collars or other such commonly used financial hedge instruments. These hedge instruments are based directly on aircraft
fuel or closely related commodities like heating oil, diesel fuel and crude oil. The Company strives to maintain fuel hedging levels and exposure such that the
Company’s fuel cost is not disproportionate to the fuel costs of its major competitors.
Some hedge instruments may result in losses if the underlying commodity prices drop below specified floors or swap prices. However, the negative impact of
these losses may be outweighed by the benefit of lower aircraft fuel cost since the Company typically hedges a portion of its future fuel requirements, and uses
swaps or sold puts (as a part of a collar) on only a portion of the fuel requirement that it does hedge. The Company does not enter into hedge instruments for
trading purposes.
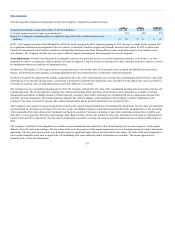
The Company may adjust its hedging program based on changes in market conditions. The following table summarizes information related to the Company’s
cost of fuel and hedging (in millions, except percentages):
In 2011, fuel cost as a percent of total operating expenses (a) 37% 37% 36%
Impact of $1 increase in price per barrel of aircraft fuel on annual fuel expense (b) $95 $ 54 $41
Asset fair value at December 31, 2011 (c) $73 $44 $29
Impact of 10% decrease in forward prices of aircraft fuel, crude oil and heating oil on the value of fuel hedges
(d) $(155) $(97) $ (58)
(a) Includes related taxes and excludes hedging impacts and special charges. In 2010, UAL’s, United’s and Continental’s fuel cost was 31%, 31%, and 29% of total operating expense, respectively.
(b) Based on 2012 projected fuel consumption.
(c) As of December 31, 2010, the net fair value of UAL’s, United’s and Continental’s fuel hedges was $375 million, $277 million and $98 million, respectively.
(d) Based on fuel hedge positions at December 31, 2011, as summarized in the table below.
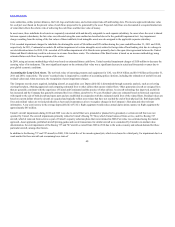
As of December 31, 2011, our projected fuel requirements for 2012 were hedged as follows:
Maximum Price Minimum Price
% of
Expected
Consumption
Weighted
Average Price
(per gallon)
% of
Expected
Consumption
Weighted
Average Price
(per gallon)
Heating oil collars 11% $3.13 11% $2.52
Heating oil call options 7 3.22 N/A N/A
Brent crude oil collars 6 2.74 6 1.91
Diesel fuel collars 4 3.12 4 2.35
Aircraft fuel swaps 1 2.90 1 2.90
WTI crude oil call options 1 2.37 N/A N/A
WTI crude oil swaps 1 2.25 1 2.25
Total 31% 23%
(a) Represents a hedge of approximately 47% of UAL’s expected first quarter consumption with decreasing hedge coverage later throughout 2012.
Foreign Currency. The Company generates revenues and incurs expenses in numerous foreign currencies. Changes in foreign currency exchange rates
impact the Company’s results of operations through changes in the dollar value of foreign currency-denominated operating revenues and expenses. Some of the
Company’s more significant foreign currency exposures include the Canadian dollar, Chinese renminbi, European euro and
65


