United Airlines 2011 Annual Report Download - page 47
Download and view the complete annual report
Please find page 47 of the 2011 United Airlines annual report below. You can navigate through the pages in the report by either clicking on the pages listed below, or by using the keyword search tool below to find specific information within the annual report.-
 1
1 -
2
-
3
-
4
-
5
-
6
-
7
-
8
-
9
-
10
-
11
-
12
-
13
-
14
-
15
-
16
-
17
-
18
-
19
-
20
-
21
-
22
-
23
-
24
-
25
-
26
-
27
-
28
-
29
-
30
-
31
-
32
-
33
-
34
-
35
-
36
-
 37
37 -
 38
38 -
 39
39 -
 40
40 -
 41
41 -
 42
42 -
 43
43 -
 44
44 -
 45
45 -
 46
46 -
 47
47 -
 48
48 -
 49
49 -
 50
50 -
 51
51 -
 52
52 -
 53
53 -
 54
54 -
 55
55 -
 56
56 -
 57
57 -
58
-
59
-
60
-
61
-
62
-
63
-
64
-
65
-
66
-
67
-
68
-
69
-
70
-
71
-
72
-
73
-
74
-
75
-
76
-
77
-
78
-
79
-
80
-
81
-
82
-
83
-
84
-
85
-
86
-
87
-
88
-
89
-
90
-
91
-
92
-
93
-
94
-
95
-
96
-
97
-
98
-
99
-
100
-
101
-
102
-
103
-
104
-
105
-
106
-
107
-
108
-
109
-
110
-
111
-
112
-
113
-
114
-
115
-
116
-
117
-
118
-
119
-
120
-
121
-
122
-
123
-
124
-
125
-
126
-
127
-
128
-
129
-
130
-
131
-
132
-
133
-
134
-
135
-
136
-
137
-
138
-
139
-
140
-
141
-
142
-
143
-
144
-
145
-
146
-
147
-
148
-
149
-
150
-
151
-
152
-
153
-
154
-
155
-
156
-
157
-
158
-
159
-
160
-
161
-
162
-
163
-
164
-
165
-
166
-
167
-
168
-
169
-
170
-
171
-
172
-
173
-
174
-
175
-
176
-
177
-
178
-
179
-
180
-
181
-
182
-
183
-
184
-
185
-
186
-
187
-
188
-
189
-
190
-
191
-
192
-
193
-
194
-
195
-
196
-
197
-
198
-
199
-
200
-
201
-
202
-
203
-
204
-
205
-
206
-
207
-
208
-
209
-
210
-
211
-
212
-
213
-
214
-
215
-
216
-
217
-
218
-
219
-
220
-
221
-
222
-
223
-
224
-
225
-
226
-
227
-
228
-
229
-
230
-
231
-
232
-
233
-
234
-
235
-
236
-
237
-
238
 |
 |

Table of Contents
United
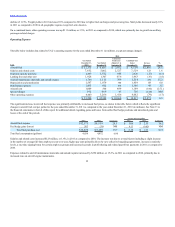
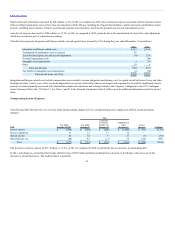
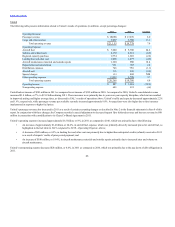
The following table presents information related to United’s results of operations (in millions, except percentage changes):
Operating Revenue:
Passenger revenue $ 18,088 $17,070 6.0
Cargo and other revenue 3,067 2,708 13.3
Total operating revenue $21,155 $19,778 7.0
Operating Expense:
Aircraft fuel $7,080 $ 5,700 24.2
Salaries and related costs 4,172 4,212 (0.9)
Regional capacity purchase 1,574 1,610 (2.2)
Landing fees and other rent 1,028 1,077 (4.5)
Aircraft maintenance materials and outside repairs 1,160 980 18.4
Depreciation and amortization 921 903 2.0
Distribution expenses 748 756 (1.1)
Aircraft rent 323 326 (0.9)
Special charges 433 468 NM
Other operating expenses 2,829 2,728 3.7
Total operating expense $20,268 $18,760 8.0
Operating income $ 887 $ 1,018 (12.9)
Nonoperating expense 603 631 (4.4)
United had net income of $281 million in 2011 as compared to net income of $399 million in 2010. As compared to 2010, United’s consolidated revenue
increased $1.4 billion, or 7%, to $21.2 billion during 2011. These increases were primarily due to year-over-year capacity discipline, which in turn resulted
in improved pricing and higher average fares, as discussed in UAL’s results of operations above. United’s traffic and capacity decreased approximately 2.2%
and 1.9%, respectively, while passenger revenue per available seat mile increased approximately 8.0%. Average fares were also higher due to fare increases
implemented in response to higher fuel prices.
United’s passenger revenue also increased in 2011 as a result of certain accounting changes as described in Note 2 to the financial statements in Item 8 of this
report. In conjunction with these changes, the Company recorded a special adjustment to decrease frequent flyer deferred revenue and increase revenue by $88
million in connection with a modification to its Chase Co-Brand Agreement in 2011.
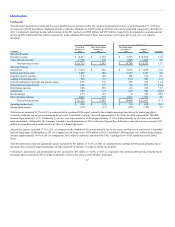
United’s operating expenses increased approximately $1.5 billion, or 8%, in 2011 as compared to 2010, which was primarily due to the following:
• An increase of approximately $1.4 billion, or 24.2%, in aircraft fuel expense, which was primarily driven by increased prices for aircraft fuel, as
highlighted in the fuel table in , above;
• A decrease of $49 million, or 4.5%, in landing fees and other rent was primarily due to higher than anticipated credits (refunds) received in 2011
as a result of airports’ audits of prior period payment; and
• An increase of $180 million, or 18.4%, in aircraft maintenance materials and outside repairs primarily due to increased rates and volume on
aircraft maintenance.
United’s nonoperating expense decreased $28 million, or 4.4%, in 2011 as compared to 2010, which was primarily due to the pay down of debt obligations in
2011.
46