United Airlines 2011 Annual Report Download - page 85
Download and view the complete annual report
Please find page 85 of the 2011 United Airlines annual report below. You can navigate through the pages in the report by either clicking on the pages listed below, or by using the keyword search tool below to find specific information within the annual report.-
 1
1 -
2
-
3
-
4
-
5
-
6
-
7
-
8
-
9
-
10
-
11
-
12
-
13
-
14
-
15
-
16
-
17
-
18
-
19
-
20
-
21
-
22
-
23
-
24
-
25
-
26
-
27
-
28
-
29
-
30
-
31
-
32
-
33
-
34
-
35
-
36
-
37
-
38
-
39
-
40
-
41
-
42
-
43
-
44
-
45
-
46
-
47
-
48
-
49
-
50
-
51
-
52
-
53
-
54
-
55
-
56
-
57
-
58
-
59
-
60
-
61
-
62
-
63
-
64
-
65
-
66
-
67
-
68
-
69
-
70
-
71
-
72
-
73
-
74
-
 75
75 -
 76
76 -
 77
77 -
 78
78 -
 79
79 -
 80
80 -
 81
81 -
 82
82 -
 83
83 -
 84
84 -
 85
85 -
 86
86 -
 87
87 -
 88
88 -
 89
89 -
 90
90 -
 91
91 -
 92
92 -
 93
93 -
 94
94 -
 95
95 -
96
-
97
-
98
-
99
-
100
-
101
-
102
-
103
-
104
-
105
-
106
-
107
-
108
-
109
-
110
-
111
-
112
-
113
-
114
-
115
-
116
-
117
-
118
-
119
-
120
-
121
-
122
-
123
-
124
-
125
-
126
-
127
-
128
-
129
-
130
-
131
-
132
-
133
-
134
-
135
-
136
-
137
-
138
-
139
-
140
-
141
-
142
-
143
-
144
-
145
-
146
-
147
-
148
-
149
-
150
-
151
-
152
-
153
-
154
-
155
-
156
-
157
-
158
-
159
-
160
-
161
-
162
-
163
-
164
-
165
-
166
-
167
-
168
-
169
-
170
-
171
-
172
-
173
-
174
-
175
-
176
-
177
-
178
-
179
-
180
-
181
-
182
-
183
-
184
-
185
-
186
-
187
-
188
-
189
-
190
-
191
-
192
-
193
-
194
-
195
-
196
-
197
-
198
-
199
-
200
-
201
-
202
-
203
-
204
-
205
-
206
-
207
-
208
-
209
-
210
-
211
-
212
-
213
-
214
-
215
-
216
-
217
-
218
-
219
-
220
-
221
-
222
-
223
-
224
-
225
-
226
-
227
-
228
-
229
-
230
-
231
-
232
-
233
-
234
-
235
-
236
-
237
-
238
 |
 |

Table of Contents
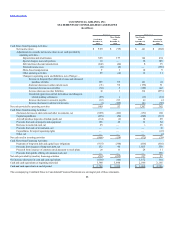
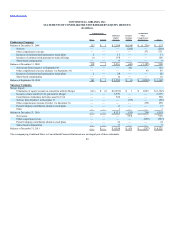
Operating revenue:
Passenger—Mainline $11,816 $2,605 $7,777 $ 9,024
Passenger—Regional 2,601 560 1,726 2,016
Total passenger revenue 14,417 3,165 9,503 11,040
Cargo 448 119 328 366
Special revenue item 19 — — —
Other operating revenue 1,291 279 957 1,217
16,175 3,563 10,788 12,623
Operating expense:
Aircraft fuel 5,294 986 2,872 3,401
Salaries and related costs 3,405 786 2,527 3,137
Regional capacity purchase 830 202 608 826
Landing fees and other rent 900 231 656 841
Aircraft maintenance materials and outside repairs 595 135 399 597
Depreciation and amortization 626 177 380 494
Distribution expenses 688 156 474 537
Aircraft rent 686 174 689 934
Special charges 159 201 47 145
Other operating expenses 2,042 537 1,416 1,855
15,225 3,585 10,068 12,767
Operating income (loss) 950 (22) 720 (144)
Nonoperating income (expense):
Interest expense (342) (86) (288) (367)
Interest capitalized 17 4 17 33
Interest income 10 3 6 12
Miscellaneous, net (72) 2 (13) 27
(387) (77) (278) (295)
Income (loss) before income taxes 563 (99) 442 (439)
Income tax expense (benefit) (6) (4) 1 (157)
Net income (loss) $569 $(95) $441 $(282)
Earnings (loss) per share, basic $ 3.16 $(2.18)
Earnings (loss) per share, diluted $ 2.81 $(2.18)
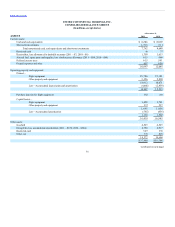
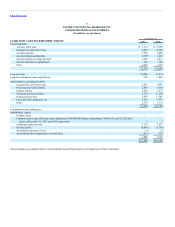
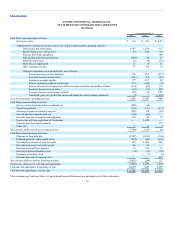
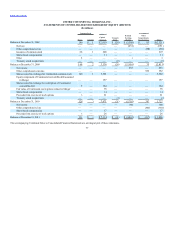
The accompanying Combined Notes to Consolidated Financial Statements are an integral part of these statements.
84