United Airlines 2011 Annual Report Download - page 116
Download and view the complete annual report
Please find page 116 of the 2011 United Airlines annual report below. You can navigate through the pages in the report by either clicking on the pages listed below, or by using the keyword search tool below to find specific information within the annual report.-
 1
1 -
2
-
3
-
4
-
5
-
6
-
7
-
8
-
9
-
10
-
11
-
12
-
13
-
14
-
15
-
16
-
17
-
18
-
19
-
20
-
21
-
22
-
23
-
24
-
25
-
26
-
27
-
28
-
29
-
30
-
31
-
32
-
33
-
34
-
35
-
36
-
37
-
38
-
39
-
40
-
41
-
42
-
43
-
44
-
45
-
46
-
47
-
48
-
49
-
50
-
51
-
52
-
53
-
54
-
55
-
56
-
57
-
58
-
59
-
60
-
61
-
62
-
63
-
64
-
65
-
66
-
67
-
68
-
69
-
70
-
71
-
72
-
73
-
74
-
75
-
76
-
77
-
78
-
79
-
80
-
81
-
82
-
83
-
84
-
85
-
86
-
87
-
88
-
89
-
90
-
91
-
92
-
93
-
94
-
95
-
96
-
97
-
98
-
99
-
100
-
101
-
102
-
103
-
104
-
105
-
 106
106 -
 107
107 -
 108
108 -
 109
109 -
 110
110 -
 111
111 -
 112
112 -
 113
113 -
 114
114 -
 115
115 -
 116
116 -
 117
117 -
 118
118 -
 119
119 -
 120
120 -
 121
121 -
 122
122 -
 123
123 -
 124
124 -
 125
125 -
 126
126 -
127
-
128
-
129
-
130
-
131
-
132
-
133
-
134
-
135
-
136
-
137
-
138
-
139
-
140
-
141
-
142
-
143
-
144
-
145
-
146
-
147
-
148
-
149
-
150
-
151
-
152
-
153
-
154
-
155
-
156
-
157
-
158
-
159
-
160
-
161
-
162
-
163
-
164
-
165
-
166
-
167
-
168
-
169
-
170
-
171
-
172
-
173
-
174
-
175
-
176
-
177
-
178
-
179
-
180
-
181
-
182
-
183
-
184
-
185
-
186
-
187
-
188
-
189
-
190
-
191
-
192
-
193
-
194
-
195
-
196
-
197
-
198
-
199
-
200
-
201
-
202
-
203
-
204
-
205
-
206
-
207
-
208
-
209
-
210
-
211
-
212
-
213
-
214
-
215
-
216
-
217
-
218
-
219
-
220
-
221
-
222
-
223
-
224
-
225
-
226
-
227
-
228
-
229
-
230
-
231
-
232
-
233
-
234
-
235
-
236
-
237
-
238
 |
 |
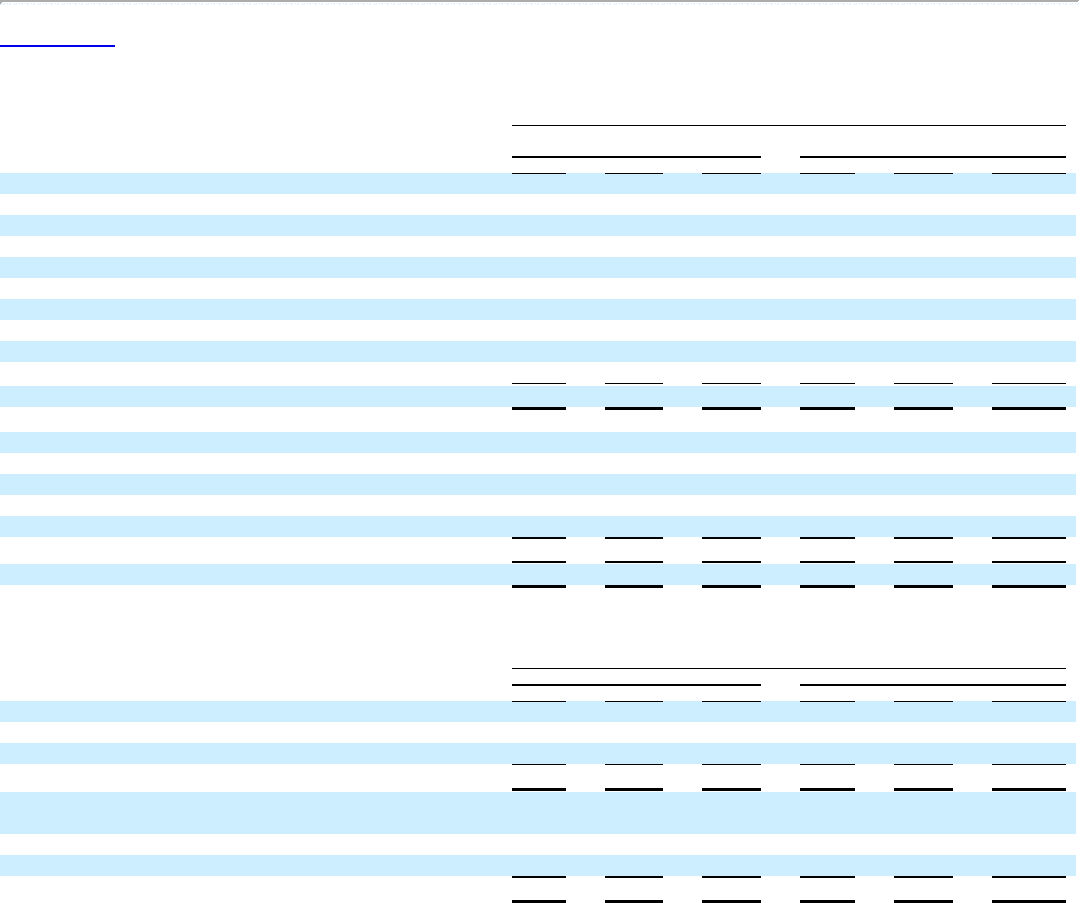
Table of Contents
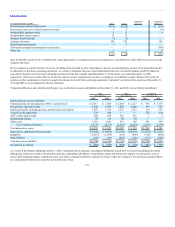
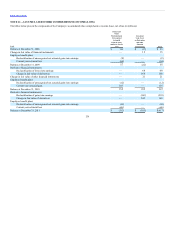
Change in benefit obligation:
Benefit obligation at beginning of year $ 2,494 $2,225 $269 $2,069 $2,069 $233
Merger impact (b) — — — 278 — 35
Service cost 47 34 13 33 30 11
Interest cost 127 113 14 118 115 13
Plan participants’ contributions 73 70 3 72 72 3
Actuarial (gain) loss (2) (25) 23 120 131 (11)
Federal subsidy 13 13 — 13 13 —
Plan amendments 3 3 — — — 2
Gross benefits paid (214) (200) (14) (209) (205) (17)
Benefit obligation at end of year $2,541 $2,233 $308 $ 2,494 $2,225 $269
Change in plan assets:
Fair value of plan assets at beginning of year $58 $58 $ — $58 $58 $ —
Actual return on plan assets 1 1 — 2 2 —
Employer contributions 141 129 12 131 131 —
Plan participants’ contributions 72 70 2 72 72 —
Benefits paid (214) (200) (14) (205) (205) —
Fair value of plan assets at end of year $58 $58 $ — $58 $58 $ —
Funded status—Net amount recognized $(2,483) $(2,175) $(308) $(2,436) $(2,167) $(269)
(a) Continental, in 2010, represents combined Predecessor and Successor. Other than remeasurement described in (b), all other activity occurred on a consistent basis throughout 2010.
(b) UAL, in 2010, represents plan assets and liabilities assumed in Merger. Continental, in 2010, represents remeasurement of the projected benefit obligation as of the Merger closing date.
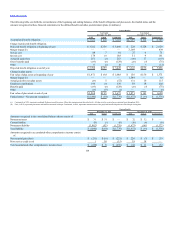
Amounts recognized in the consolidated balance sheets consist of:
Current liability $ (76) $(60) $ (16) $ (92) $ (76) $ (16)
Noncurrent liability (2,407) (2,115) (292) (2,344) (2,091) (253)
Total liability $(2,483) $(2,175) $(308) $(2,436) $(2,167) $(269)
Amounts recognized in accumulated other comprehensive income
consist of:
Net actuarial gain (loss) $33 $ 46 $(13) $24 $13 $11
Prior service cost (2) (2) — — — —
Total accumulated other comprehensive income (loss) $31 $44 $(13) $24 $13 $11
(a) Continental, in 2010, represents combined Predecessor and Successor.
115