United Airlines 2011 Annual Report Download - page 119
Download and view the complete annual report
Please find page 119 of the 2011 United Airlines annual report below. You can navigate through the pages in the report by either clicking on the pages listed below, or by using the keyword search tool below to find specific information within the annual report.-
 1
1 -
2
-
3
-
4
-
5
-
6
-
7
-
8
-
9
-
10
-
11
-
12
-
13
-
14
-
15
-
16
-
17
-
18
-
19
-
20
-
21
-
22
-
23
-
24
-
25
-
26
-
27
-
28
-
29
-
30
-
31
-
32
-
33
-
34
-
35
-
36
-
37
-
38
-
39
-
40
-
41
-
42
-
43
-
44
-
45
-
46
-
47
-
48
-
49
-
50
-
51
-
52
-
53
-
54
-
55
-
56
-
57
-
58
-
59
-
60
-
61
-
62
-
63
-
64
-
65
-
66
-
67
-
68
-
69
-
70
-
71
-
72
-
73
-
74
-
75
-
76
-
77
-
78
-
79
-
80
-
81
-
82
-
83
-
84
-
85
-
86
-
87
-
88
-
89
-
90
-
91
-
92
-
93
-
94
-
95
-
96
-
97
-
98
-
99
-
100
-
101
-
102
-
103
-
104
-
105
-
106
-
107
-
108
-
 109
109 -
 110
110 -
 111
111 -
 112
112 -
 113
113 -
 114
114 -
 115
115 -
 116
116 -
 117
117 -
 118
118 -
 119
119 -
 120
120 -
 121
121 -
 122
122 -
 123
123 -
 124
124 -
 125
125 -
 126
126 -
 127
127 -
 128
128 -
 129
129 -
130
-
131
-
132
-
133
-
134
-
135
-
136
-
137
-
138
-
139
-
140
-
141
-
142
-
143
-
144
-
145
-
146
-
147
-
148
-
149
-
150
-
151
-
152
-
153
-
154
-
155
-
156
-
157
-
158
-
159
-
160
-
161
-
162
-
163
-
164
-
165
-
166
-
167
-
168
-
169
-
170
-
171
-
172
-
173
-
174
-
175
-
176
-
177
-
178
-
179
-
180
-
181
-
182
-
183
-
184
-
185
-
186
-
187
-
188
-
189
-
190
-
191
-
192
-
193
-
194
-
195
-
196
-
197
-
198
-
199
-
200
-
201
-
202
-
203
-
204
-
205
-
206
-
207
-
208
-
209
-
210
-
211
-
212
-
213
-
214
-
215
-
216
-
217
-
218
-
219
-
220
-
221
-
222
-
223
-
224
-
225
-
226
-
227
-
228
-
229
-
230
-
231
-
232
-
233
-
234
-
235
-
236
-
237
-
238
 |
 |

Table of Contents
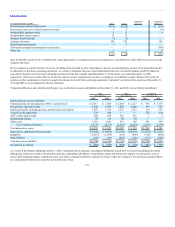
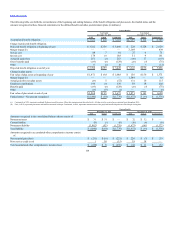
Discount rate (a) 4.93% 5.15% 4.78% 4.97% 4.58%
Discount rate 5.15% 5.69% 4.97% 4.58% 5.57%
Expected return on plan assets 4.00% 4.00% N/A N/A N/A
Health care cost trend rate assumed for next year 7.00% 8.00% 7.00% 7.50% 7.50%
Rate to which the cost trend rate is assumed to decline (ultimate trend rate
in 2020) 5.00% 5.00% 5.00% 5.00%
(a) The 2010 discount rate used to determine benefit obligations at the Merger closing date is 4.58%.
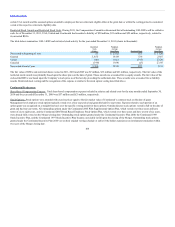
UAL selected the 2011 discount rate for each of its plans by using a hypothetical portfolio of high quality bonds at December 31, 2011, that would provide
the necessary cash flows to match projected benefit payments. Prior to 2011, the discount rate was selected using a cash flow matching technique where
projected benefit payments were matched to a yield curve based on high quality bond yields as of the measurement date. This change increased the discount
rate which lowered the present value of the liability at UAL, United and Continental by approximately $525 million, $200 million and $325 million,
respectively.
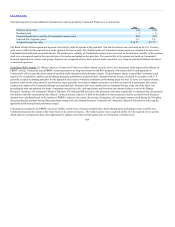
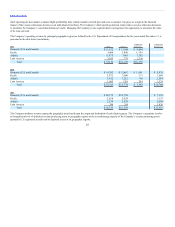
We develop our expected long-term rate of return assumption based on historical experience and by evaluating input from the trustee managing the plans’
assets.Our expected long-term rate of return on plan assets is based on a target allocation of assets, which is based on our goal of earning the highest rate of
return while maintaining risk at acceptable levels. The plans strive to have assets sufficiently diversified so that adverse or unexpected results from one
security class will not have an unduly detrimental impact on the entire portfolio. We regularly review our actual asset allocation and the pension plans’
investments are periodically rebalanced to our targeted allocation when considered appropriate. Continental’s plan assets are allocated within the following
guidelines:
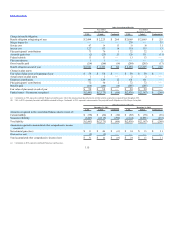
Percent of Total
Expected Long-
Term
Rate of Return
Equity securities 38-54% 10%
Fixed-income securities 27-33 6
Alternatives 17-23 7
Other 2-6 4
United’s target allocation for the defined benefit pension plan assets is 54% in equity securities and 46% in fixed income securities, while 100% of other
postretirement plan assets are invested in a deposit administration fund.
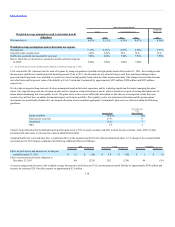
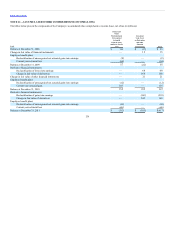
Assumed health care cost trend rates have a significant effect on the amounts reported for the other postretirement plans. A 1% change in the assumed health
care trend rate for the Company would have the following additional effects (in millions):
Effect on total service and interest cost for the year
ended December 31, 2011 $ 21 $(18) $ 18 $ (15) $3 $(3)
Effect on postretirement benefit obligation at
December 31, 2011 308 (255) 262 (219) 46 (36)
A one percentage point decrease in the weighted average discount rate would increase UAL’s postretirement benefit liability by approximately $308 million and
increase the estimated 2011 benefits expense by approximately $21 million.
118