United Airlines 2011 Annual Report Download - page 131
Download and view the complete annual report
Please find page 131 of the 2011 United Airlines annual report below. You can navigate through the pages in the report by either clicking on the pages listed below, or by using the keyword search tool below to find specific information within the annual report.-
 1
1 -
2
-
3
-
4
-
5
-
6
-
7
-
8
-
9
-
10
-
11
-
12
-
13
-
14
-
15
-
16
-
17
-
18
-
19
-
20
-
21
-
22
-
23
-
24
-
25
-
26
-
27
-
28
-
29
-
30
-
31
-
32
-
33
-
34
-
35
-
36
-
37
-
38
-
39
-
40
-
41
-
42
-
43
-
44
-
45
-
46
-
47
-
48
-
49
-
50
-
51
-
52
-
53
-
54
-
55
-
56
-
57
-
58
-
59
-
60
-
61
-
62
-
63
-
64
-
65
-
66
-
67
-
68
-
69
-
70
-
71
-
72
-
73
-
74
-
75
-
76
-
77
-
78
-
79
-
80
-
81
-
82
-
83
-
84
-
85
-
86
-
87
-
88
-
89
-
90
-
91
-
92
-
93
-
94
-
95
-
96
-
97
-
98
-
99
-
100
-
101
-
102
-
103
-
104
-
105
-
106
-
107
-
108
-
109
-
110
-
111
-
112
-
113
-
114
-
115
-
116
-
117
-
118
-
119
-
120
-
 121
121 -
 122
122 -
 123
123 -
 124
124 -
 125
125 -
 126
126 -
 127
127 -
 128
128 -
 129
129 -
 130
130 -
 131
131 -
 132
132 -
 133
133 -
 134
134 -
 135
135 -
 136
136 -
 137
137 -
 138
138 -
 139
139 -
 140
140 -
 141
141 -
142
-
143
-
144
-
145
-
146
-
147
-
148
-
149
-
150
-
151
-
152
-
153
-
154
-
155
-
156
-
157
-
158
-
159
-
160
-
161
-
162
-
163
-
164
-
165
-
166
-
167
-
168
-
169
-
170
-
171
-
172
-
173
-
174
-
175
-
176
-
177
-
178
-
179
-
180
-
181
-
182
-
183
-
184
-
185
-
186
-
187
-
188
-
189
-
190
-
191
-
192
-
193
-
194
-
195
-
196
-
197
-
198
-
199
-
200
-
201
-
202
-
203
-
204
-
205
-
206
-
207
-
208
-
209
-
210
-
211
-
212
-
213
-
214
-
215
-
216
-
217
-
218
-
219
-
220
-
221
-
222
-
223
-
224
-
225
-
226
-
227
-
228
-
229
-
230
-
231
-
232
-
233
-
234
-
235
-
236
-
237
-
238
 |
 |

Table of Contents
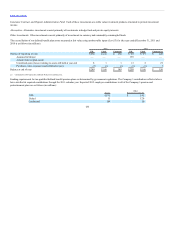
Nonrecurring Fair Value Measurements
The table below presents fair value measurements of nonfinancial assets that were performed during the years ended December 31, (in millions):
Nonoperating aircraft and spare engines $ — $— $ 128 $120
Routes — — 124 29
Airport slots 8 4 — —
Nonoperating aircraft and spare engines $ — $— $ 128 $120
Routes — — 124 29
Airport slots $ 8 $4 $ — $—
The Company utilized the market approach to estimate the fair value of its aircraft. The Company determined the estimated fair value of the routes using an
income approach. Slots were valued using a combination of the income and market approaches. Where no value is indicated in the table above, a fair value
measurement was not performed that year. The Company considers the valuation of the items above to be Level 3 due to the inclusion of unobservable inputs.
During 2011, Continental recorded impairment charges of $4 million on certain intangible assets related to foreign take-off and landing slots to reflect the
estimated fair value of these assets as part of its annual impairment test of indefinite-lived intangible assets.
During 2010, United recorded impairments of nonoperating aircraft and spare engines totaling $120 million, primarily due to a decrease in the market value of
its nonoperating Boeing 737 and 747 aircraft. United also recorded a $29 million impairment to its indefinite-lived route asset in Brazil, due to a decrease in
the value of these routes as a result of an open skies agreement between the United States and Brazil.
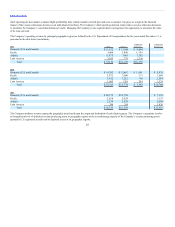
Fuel Derivatives
As of December 31, 2011, our projected fuel requirements for 2012 were hedged as follows:
Maximum Price Minimum Price
% of
Expected
Consumption
Weighted
Average Price
(per gallon)
% of
Expected
Consumption
Weighted
Average Price
(per gallon)
Heating oil collars 11% $3.13 11% $2.52
Heating oil call options 7 3.22 N/A N/A
Brent crude oil collars 6 2.74 6 1.91
Diesel fuel collars 4 3.12 4 2.35
Aircraft fuel swaps 1 2.90 1 2.90
WTI crude oil call options 1 2.37 N/A N/A
WTI crude oil swaps 1 2.25 1 2.25
Total 31% 23%
(a) Represents a hedge of approximately 47% of UAL’s expected first quarter consumption with decreasing hedge coverage later throughout 2012.
130