United Airlines 2011 Annual Report Download - page 43
Download and view the complete annual report
Please find page 43 of the 2011 United Airlines annual report below. You can navigate through the pages in the report by either clicking on the pages listed below, or by using the keyword search tool below to find specific information within the annual report.
Table of Contents
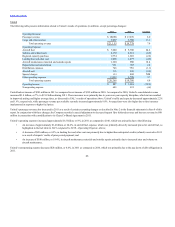
related to the Company’s portfolio of crude oil derivative contracts. In 2010, miscellaneous, net included a gain of $21 million from the distribution to United
of the remaining United Series 2001-1 enhanced equipment trust certificate (“EETC”) trust assets upon repayment of the note obligations.
Operating Revenue
To provide a more meaningful comparison of UAL’s 2010 financial performance to 2009, we quantified the increases relating to our operating results that are
due to Continental’s results after the Merger closing date. The increases due to the Merger, presented in the tables below, represent actual Continental Successor
results for the fourth quarter of 2010. The discussion of UAL’s results excludes the impact of Continental Successor results in the fourth quarter of 2010.
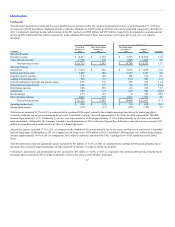
The table below illustrates the year-over-year percentage change in UAL’s operating revenues for the years ended December 31 (in millions, except percentage
changes):
Passenger—Mainline $16,019 $11,313 $ 4,706 $2,605 $2,101 18.6
Passenger—Regional 4,217 2,884 1,333 560 773 26.8
Total passenger revenue 20,236 14,197 6,039 3,165 2,874 20.2
Cargo 832 536 296 119 177 33.0
Other operating revenue 2,257 1,602 655 279 376 23.5
$ 23,325 $16,335 $6,990 $3,563 $3,427 21.0
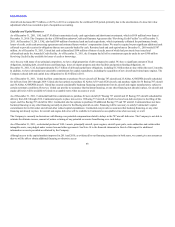
The table below presents selected UAL passenger revenue and selected operating data based on geographic region:
Passenger revenue (in millions) $581 $ 817 $560 $143 $2,101 $773 $ 2,874
Passenger revenue 8.9% 36.6% 25.4% 42.1% 18.6% 26.8% 20.2%
Average fare per passenger 15.3% 26.6% 20.6% 31.9% 23.0% 12.7% 18.6%
Yield 10.6% 26.4% 20.0% 31.0% 16.4% 6.5% 15.7%
PRASM 12.2% 37.0% 20.6% 35.5% 19.6% 9.2% 18.7%
Average stage length 5.8% (1.3)% (1.8)% (1.3)% 5.8% 8.5% 3.0%
Passengers (5.5)% 7.8% 3.9% 7.7% (3.7)% 12.5% 1.4%
RPMs (traffic) (1.5)% 8.0% 4.4% 8.4% 1.9% 19.0% 3.9%
ASMs (capacity) (3.0)% (0.4)% 4.0% 4.8% (0.9)% 16.1% 1.3%
Passenger load factor 1.3 pts. 6.6 pts. 0.3 pts. 2.7 pts. 2.2 pts. 1.9 pts. 2.1 pts.
Excluding the impact of the Merger, consolidated passenger revenue in 2010 increased approximately $2.9 billion, or 20.2%, as compared to 2009. These
increases were due to increases of 18.6% and 15.7% in average fare per passenger and yield, respectively, over the same period as a result of strengthening
economic conditions and industry capacity discipline. An increase in volume in 2010, as measured by passenger volume also contributed to the increase in
revenues in 2010 as compared to 2009. The revenue improvement in 2010 was also driven by the return of business and international premium cabin
passengers whose higher ticket prices combined to increase average fare per passenger and yields. The international regions in particular had the largest
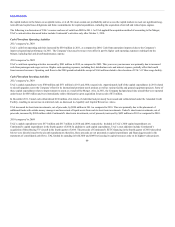
increases in demand with international passenger unit revenue per ASM increasing 29.4% on a 1.8% increase in capacity. Passenger revenue in 2010 included
approximately $250 million of additional revenue due to changes in the Company’s estimate and methodology related to loyalty program accounting as noted
in below.
42


