United Airlines 2011 Annual Report Download - page 38
Download and view the complete annual report
Please find page 38 of the 2011 United Airlines annual report below. You can navigate through the pages in the report by either clicking on the pages listed below, or by using the keyword search tool below to find specific information within the annual report.-
 1
1 -
2
-
3
-
4
-
5
-
6
-
7
-
8
-
9
-
10
-
11
-
12
-
13
-
14
-
15
-
16
-
17
-
18
-
19
-
20
-
21
-
22
-
23
-
24
-
25
-
26
-
27
-
 28
28 -
 29
29 -
 30
30 -
 31
31 -
 32
32 -
 33
33 -
 34
34 -
 35
35 -
 36
36 -
 37
37 -
 38
38 -
 39
39 -
 40
40 -
 41
41 -
 42
42 -
 43
43 -
 44
44 -
 45
45 -
 46
46 -
 47
47 -
 48
48 -
49
-
50
-
51
-
52
-
53
-
54
-
55
-
56
-
57
-
58
-
59
-
60
-
61
-
62
-
63
-
64
-
65
-
66
-
67
-
68
-
69
-
70
-
71
-
72
-
73
-
74
-
75
-
76
-
77
-
78
-
79
-
80
-
81
-
82
-
83
-
84
-
85
-
86
-
87
-
88
-
89
-
90
-
91
-
92
-
93
-
94
-
95
-
96
-
97
-
98
-
99
-
100
-
101
-
102
-
103
-
104
-
105
-
106
-
107
-
108
-
109
-
110
-
111
-
112
-
113
-
114
-
115
-
116
-
117
-
118
-
119
-
120
-
121
-
122
-
123
-
124
-
125
-
126
-
127
-
128
-
129
-
130
-
131
-
132
-
133
-
134
-
135
-
136
-
137
-
138
-
139
-
140
-
141
-
142
-
143
-
144
-
145
-
146
-
147
-
148
-
149
-
150
-
151
-
152
-
153
-
154
-
155
-
156
-
157
-
158
-
159
-
160
-
161
-
162
-
163
-
164
-
165
-
166
-
167
-
168
-
169
-
170
-
171
-
172
-
173
-
174
-
175
-
176
-
177
-
178
-
179
-
180
-
181
-
182
-
183
-
184
-
185
-
186
-
187
-
188
-
189
-
190
-
191
-
192
-
193
-
194
-
195
-
196
-
197
-
198
-
199
-
200
-
201
-
202
-
203
-
204
-
205
-
206
-
207
-
208
-
209
-
210
-
211
-
212
-
213
-
214
-
215
-
216
-
217
-
218
-
219
-
220
-
221
-
222
-
223
-
224
-
225
-
226
-
227
-
228
-
229
-
230
-
231
-
232
-
233
-
234
-
235
-
236
-
237
-
238
 |
 |

Table of Contents
operating results and/or from our anticipated results of operations described in our forward-looking statements in this report. See Item 1A, , for
further discussion of these and other factors that could affect us.
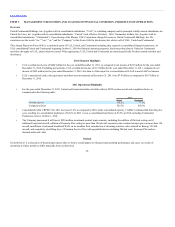
Merger Integration. During 2011, the Company received a single operating certificate from the Federal Aviation Administration (the “FAA”), marking a
significant achievement in the integration of United and Continental. The certificate gives the FAA a single point of oversight for our combined operations. It
also allows all maintenance and operating activities to be considered as “United” by the FAA.
In 2011, the Company announced that MileagePlus will be the loyalty program for the Company beginning in 2012.
The Company has co-located check-in, ticket counter and gate facilities at 66 airports since closing the Merger and now has a single area for check-in at 291
airports systemwide. More than 800 aircraft are now rebranded in the new United livery.
Some key initiatives for the Company in 2012 include converting to a single passenger service system, harmonizing other information technology systems,
moving to a single website, making substantial fleet reallocations around the system and working to integrate certain employee groups. We currently expect to
migrate to a single passenger service system in early March 2012, allowing the Company to operate using a single carrier code, flight schedule, inventory,
website and departure control system.
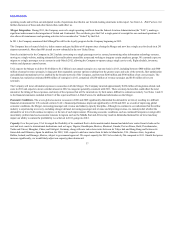
UAL expects the Merger to deliver $1.0 billion to $1.2 billion in net annual synergies on a run-rate basis in 2013, including between $800 million and $900
million of annual revenue synergies, in large part from expanded customer options resulting from the greater scope and scale of the network, fleet optimization
and additional international service enabled by the broader network of the Company, and between $200 million and $300 million of net cost synergies. The
Company has realized an estimated $400 million of synergies in 2011, comprised of $250 million of revenue synergies and $150 million of net cost
synergies.
The Company will incur substantial expenses in connection with the Merger. The Company incurred approximately $450 million of integration-related cash
costs in 2011 and expects to incur a similar amount in 2012 in categories generally consistent with 2011. There are many factors that could affect the total
amount or the timing of those expenses, and many of the expenses that will be incurred are, by their nature, difficult to estimate accurately. See Notes 1 and 21
to the financial statements included in Item 8 of this report and Item 1A, Risk Factors, for additional information on the Merger.
Economic Conditions. The severe global economic recession in 2008 and 2009 significantly diminished the demand for air travel, resulting in a difficult
financial environment for U.S. network carriers. UAL’s financial performance improved significantly in 2010 and 2011 as a result of improving global
economic conditions, the Merger, increasing passenger unit revenue and industry capacity discipline. Although we continue to see indications that the airline
industry is experiencing a recovery, including stronger demand, increasing passenger unit revenue and improving revenue, we cannot predict whether the
demand for air travel will continue to improve or the rate of such improvement. Worsening economic conditions, such as continued European sovereign debt
uncertainty, political and socioeconomic tensions in regions such as the Middle East and Africa may result in diminished demand for air travel and may
impair our ability to sustain the profitability we achieved in 2011 going into 2012.
Capacity. Over the past year, UAL leveraged the flexibility of its combined fleet to better match market demand and added new routes from its hubs on the
east and west coasts to international destinations such as Lagos, Nigeria; Guadalajara, Mexico; Montreal, Canada; Port au Prince, Haiti; Providenciales,
Turks and Caicos; Shanghai, China; and Stuttgart, Germany, along with new intra-Asia routes between its Tokyo hub and Hong Kong and between its
Guam hub and Okinawa, Japan. In addition, for 2012, UAL expects to add new routes from its hubs to Manchester, U.K.; Buenos Aires, Argentina;
Dublin, Ireland; and Durango, Mexico, subject to government approval. We expect capacity for 2012 to be relatively flat compared to 2011. Should fuel prices
increase significantly, we would likely adjust our capacity plans downward.
37