US Airways 2005 Annual Report Download - page 73
Download and view the complete annual report
Please find page 73 of the 2005 US Airways annual report below. You can navigate through the pages in the report by either clicking on the pages listed below, or by using the keyword search tool below to find specific information within the annual report.-
 1
1 -
2
-
3
-
4
-
5
-
6
-
7
-
8
-
9
-
10
-
11
-
12
-
13
-
14
-
15
-
16
-
17
-
18
-
19
-
20
-
21
-
22
-
23
-
24
-
25
-
26
-
27
-
28
-
29
-
30
-
31
-
32
-
33
-
34
-
35
-
36
-
37
-
38
-
39
-
40
-
41
-
42
-
43
-
44
-
45
-
46
-
47
-
48
-
49
-
50
-
51
-
52
-
53
-
54
-
55
-
56
-
57
-
58
-
59
-
60
-
61
-
62
-
 63
63 -
 64
64 -
 65
65 -
 66
66 -
 67
67 -
 68
68 -
 69
69 -
 70
70 -
 71
71 -
 72
72 -
 73
73 -
 74
74 -
 75
75 -
 76
76 -
 77
77 -
 78
78 -
 79
79 -
 80
80 -
 81
81 -
 82
82 -
 83
83 -
84
-
85
-
86
-
87
-
88
-
89
-
90
-
91
-
92
-
93
-
94
-
95
-
96
-
97
-
98
-
99
-
100
-
101
-
102
-
103
-
104
-
105
-
106
-
107
-
108
-
109
-
110
-
111
-
112
-
113
-
114
-
115
-
116
-
117
-
118
-
119
-
120
-
121
-
122
-
123
-
124
-
125
-
126
-
127
-
128
-
129
-
130
-
131
-
132
-
133
-
134
-
135
-
136
-
137
-
138
-
139
-
140
-
141
-
142
-
143
-
144
-
145
-
146
-
147
-
148
-
149
-
150
-
151
-
152
-
153
-
154
-
155
-
156
-
157
-
158
-
159
-
160
-
161
-
162
-
163
-
164
-
165
-
166
-
167
-
168
-
169
-
170
-
171
-
172
-
173
-
174
-
175
-
176
-
177
-
178
-
179
-
180
-
181
-
182
-
183
-
184
-
185
-
186
-
187
-
188
-
189
-
190
-
191
-
192
-
193
-
194
-
195
-
196
-
197
-
198
-
199
-
200
-
201
-
202
-
203
-
204
-
205
-
206
-
207
-
208
-
209
-
210
-
211
-
212
-
213
-
214
-
215
-
216
-
217
-
218
-
219
-
220
-
221
-
222
-
223
-
224
-
225
-
226
-
227
-
228
-
229
-
230
-
231
-
232
-
233
-
234
-
235
-
236
-
237
-
238
-
239
-
240
-
241
-
242
-
243
-
244
-
245
-
246
-
247
-
248
-
249
-
250
-
251
-
252
-
253
-
254
-
255
-
256
-
257
-
258
-
259
-
260
-
261
-
262
-
263
-
264
-
265
-
266
-
267
-
268
-
269
-
270
-
271
-
272
-
273
-
274
-
275
-
276
-
277
-
278
-
279
-
280
-
281
-
282
-
283
-
284
-
285
-
286
-
287
-
288
-
289
-
290
-
291
-
292
-
293
-
294
-
295
-
296
-
297
-
298
-
299
-
300
-
301
-
302
-
303
-
304
-
305
-
306
-
307
-
308
-
309
-
310
-
311
-
312
-
313
-
314
-
315
-
316
-
317
-
318
-
319
-
320
-
321
-
322
-
323
 |
 |
Table of Contents
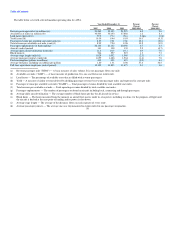
The table below sets forth the major components of US Airways' mainline CASM (in cents):
Year Ended
December 31, Percent
Change
2004 2003 2004-2003
Aircraft fuel and related taxes 1.86 1.49 24.8
Salaries and related costs 4.07 4.67 (12.8)
Aircraft rent 0.75 0.77 (2.6)
Aircraft maintenance 0.56 0.62 (9.7)
Other rent and landing fees 0.74 0.78 (5.1)
Selling expenses 0.68 0.73 (6.8)
Special charges, net — 0.07 —
Depreciation and amortization 0.41 0.42 (2.4)
Government compensation — (0.41) —
Other 1.92 1.98 (3.0)
10.99 11.12 (1.2)
Significant changes in the components of mainline CASM are explained as follows:
• Aircraft fuel and related tax expense per ASM increased 24.8% primarily due to a 27.3% increase in the average price per gallon of fuel from $0.88 in
2003 to $1.12 in 2004.
• Salaries and related costs per ASM decreased 12.8% primarily due to lower employee pension, medical and dental and postretirement medical benefit
expense, and an $89 million decrease in stock-compensation expense related to the issuance of US Airways Group Class A common stock to employees
covered by collective bargaining agreements following the emergence from the first bankruptcy in 2003, reduced headcount in 2004 as compared to
2003, and lower wage rates in the fourth quarter of 2004 as a result of interim or permanent relief from labor contracts.
• Aircraft rent expense per ASM decreased 2.6% due to increases in mainline stage length while total aircraft rent remained flat from 2004 as compared
to full year 2003.
• Aircraft maintenance per ASM decreased 9.7% reflecting lower costs associated with third-party engine and airframe repair services and the write-off
of certain surplus inventory in the second quarter of 2003.
• Selling expenses per ASM decreased 6.8% primarily due to reduction in commissions, partially offset by increases in advertising and computer
reservations fees.
• US Airways recorded $34 million of special charges in 2003 primarily related to aircraft order cancellation penalties. See note 4 to US Airways'
financial statements in Item 8C of this report.
• Depreciation and amortization per ASM decreased 2.4% due to lower book values on the existing fleet as a result of fresh-start reporting effective
March 31, 2003 and due to reduced amortization associated with capitalized software, partially offset by the write-off of certain ground equipment and
an indefinite lived foreign slot.
• Other operating expenses per ASM decreased due to reductions in insurance expense and schedule-related expenses including passenger food expenses,
partially offset by increases in the cost associated with the redemption of Dividend Miles for travel on partner airlines and future travel on US Airways
as well as increases in to costs associated with passenger and baggage screening and navigation fees. The 2003 period also includes $28 million in
reductions to an accrual upon the resolution of previously outstanding contingencies.
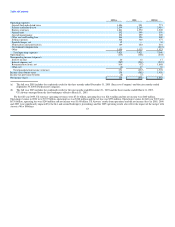
Express expenses increased $303 million, or 23.9%, in 2004 as compared to 2003. This increase reflects a 24.7% increase in Express ASMs, including a
12.7% increase in purchased ASMs, the 67