US Airways 2005 Annual Report Download - page 59
Download and view the complete annual report
Please find page 59 of the 2005 US Airways annual report below. You can navigate through the pages in the report by either clicking on the pages listed below, or by using the keyword search tool below to find specific information within the annual report.-
 1
1 -
2
-
3
-
4
-
5
-
6
-
7
-
8
-
9
-
10
-
11
-
12
-
13
-
14
-
15
-
16
-
17
-
18
-
19
-
20
-
21
-
22
-
23
-
24
-
25
-
26
-
27
-
28
-
29
-
30
-
31
-
32
-
33
-
34
-
35
-
36
-
37
-
38
-
39
-
40
-
41
-
42
-
43
-
44
-
45
-
46
-
47
-
48
-
 49
49 -
 50
50 -
 51
51 -
 52
52 -
 53
53 -
 54
54 -
 55
55 -
 56
56 -
 57
57 -
 58
58 -
 59
59 -
 60
60 -
 61
61 -
 62
62 -
 63
63 -
 64
64 -
 65
65 -
 66
66 -
 67
67 -
 68
68 -
 69
69 -
70
-
71
-
72
-
73
-
74
-
75
-
76
-
77
-
78
-
79
-
80
-
81
-
82
-
83
-
84
-
85
-
86
-
87
-
88
-
89
-
90
-
91
-
92
-
93
-
94
-
95
-
96
-
97
-
98
-
99
-
100
-
101
-
102
-
103
-
104
-
105
-
106
-
107
-
108
-
109
-
110
-
111
-
112
-
113
-
114
-
115
-
116
-
117
-
118
-
119
-
120
-
121
-
122
-
123
-
124
-
125
-
126
-
127
-
128
-
129
-
130
-
131
-
132
-
133
-
134
-
135
-
136
-
137
-
138
-
139
-
140
-
141
-
142
-
143
-
144
-
145
-
146
-
147
-
148
-
149
-
150
-
151
-
152
-
153
-
154
-
155
-
156
-
157
-
158
-
159
-
160
-
161
-
162
-
163
-
164
-
165
-
166
-
167
-
168
-
169
-
170
-
171
-
172
-
173
-
174
-
175
-
176
-
177
-
178
-
179
-
180
-
181
-
182
-
183
-
184
-
185
-
186
-
187
-
188
-
189
-
190
-
191
-
192
-
193
-
194
-
195
-
196
-
197
-
198
-
199
-
200
-
201
-
202
-
203
-
204
-
205
-
206
-
207
-
208
-
209
-
210
-
211
-
212
-
213
-
214
-
215
-
216
-
217
-
218
-
219
-
220
-
221
-
222
-
223
-
224
-
225
-
226
-
227
-
228
-
229
-
230
-
231
-
232
-
233
-
234
-
235
-
236
-
237
-
238
-
239
-
240
-
241
-
242
-
243
-
244
-
245
-
246
-
247
-
248
-
249
-
250
-
251
-
252
-
253
-
254
-
255
-
256
-
257
-
258
-
259
-
260
-
261
-
262
-
263
-
264
-
265
-
266
-
267
-
268
-
269
-
270
-
271
-
272
-
273
-
274
-
275
-
276
-
277
-
278
-
279
-
280
-
281
-
282
-
283
-
284
-
285
-
286
-
287
-
288
-
289
-
290
-
291
-
292
-
293
-
294
-
295
-
296
-
297
-
298
-
299
-
300
-
301
-
302
-
303
-
304
-
305
-
306
-
307
-
308
-
309
-
310
-
311
-
312
-
313
-
314
-
315
-
316
-
317
-
318
-
319
-
320
-
321
-
322
-
323
 |
 |

Table of Contents
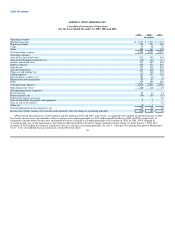
In 2005, AWA's mainline cost per available seat mile ("CASM") was 9.28 cents, which included a $222 million year-over-year increase in fuel expense,
as the average cost per gallon of fuel increased 37.4% in 2005 to $1.80. US Airways' mainline CASM was 10.80 cents in 2005, which included a $495 million
year-over-year increase in fuel expense as the average cost per gallon of fuel increased 58.0% in 2005 to $1.77, while mainline fuel consumption decreased
4.8% for the same period. In the fourth quarter of 2005, the first full quarter following the effective date of the merger, AWA's and US Airways' mainline
CASM was 11.20 cents on a combined basis, which included a $147 million quarter-over-quarter increase in fuel expense as the average cost per gallon of
fuel increased 49.9% in the fourth quarter of 2005 to $2.08. We believe our combined mainline CASM will remain competitive with the low cost carriers and
among the lowest of the traditional legacy carriers, particularly as the benefits of our cost synergies are realized.
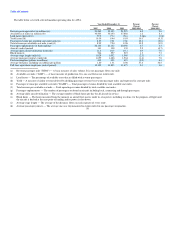
Revenue Pricing Environment
The revenue environment improved dramatically during 2005 as AWA's mainline passenger revenue per available seat mile ("PRASM") increased 13.1%
to 8.27 cents from 7.31 cents in 2004. The increase in US Airways' mainline PRASM was more modest (1.2%), increasing to 9.44 cents in 2005 from
9.33 cents in 2004. In the fourth quarter 2005, the first full quarter following the effectiveness of the merger, AWA's and US Airways' mainline PRASM
increased to 9.32 cents in the 2005 period from 7.23 cents in the 2004 period on a combined basis. The improvement in mainline PRASM during 2005 was
driven by: (1) a reduction in industry capacity growth, which led to pricing power and yielded growth for the entire industry; (2) strong leisure demand; and
(3) in the fourth quarter, realization of some of the synergy benefits from the merger, including the implementation of a code share agreement between AWA
and US Airways that helped each airline sell more tickets, an improved and combined frequent flyer program and a rationalized route network that eliminated
capacity on our weakest routes.
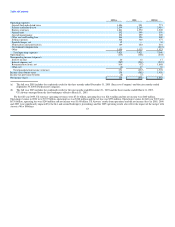
Customer Service
We are committed to building a successful combined airline by taking care of our customers. We believe that our focus on excellent customer service in
every aspect of our operations including personnel, flight equipment, inflight and ancillary amenities, on-time performance, flight completion ratios and
baggage handling, will strengthen customer loyalty and affect new customers. Combined DOT measures as reported by AWA and US Airways for the years
2005, 2004 and 2003 and for the fourth quarter of 2005 were as follows:
Fourth Full Year
Quarter
2005 2005 2004 2003
On-time performance(a) 80.7 77.8 78.1 80.4
Completion factor(b) 98.7 98.2 98.4 98.6
Mishandled baggage(c) 6.90 7.68 4.85 3.46
Customer complaints(d) 1.26 1.55 1.14 0.88
(a) Percentage of reported flight operations arriving on time.
(b) Percentage of scheduled flight operations completed.
(c) Rate of mishandled baggage reports per 1,000 passengers.
(d) Rate of customer complaints filed with the DOT per 100,000 passengers.
In January 2006, the combined AWA and US Airways mainline on-time performance as reported to the DOT was 81.1%, which placed second among the
major U.S. carriers. Customer complaints for the month of January 2006 (1.28 per 100,000 passengers) placed fifth among the major U.S. carriers. The
number of mishandled bags (8.45 per 1000 passengers) in January 2006, while tenth among the major U.S. carriers, was improved versus the month of
December 2005. 53